This chapter was copied with permission from Nick Strobel’s Astronomy Notes. Go to his site at www.astronomynotes.com for the updated and corrected version.
Stellar Properties
Notes for the properties of stars and how we determine them. Things like distances to stars, their masses, radii, composition and speeds. Also HR diagram, spectral types, and spectroscopic parallax. The dangers of selection effects and biased samples are also discussed with the application of finding what a typical star is like.
11.1 Introduction
Stars are hundreds of thousands of times farther away from us than the planets are from us. The nearest star (other than the Sun) is so far away that the fastest spacecraft the human race has built so far would take almost several tens of thousands of years to get there. Yet we are a curious and ambitious species, and we want to know how those stars are born, live out their lives, and die. How can we learn about objects that are so remote and beyond our physical grasp? This chapter gives you an idea of how we learn about the stars and what we find about the stars. Because the stars in our galaxy are so far away, they appear as just pinpoints of light in even the most powerful of telescopes on the ground or in space. We have to rely on the information encoded in the feeble starlight. Before continuing with this chapter, be sure to review carefully the concepts in the Electromagnetic Radiation (Light) chapter so that you will understand this Stellar Properties chapter.
By the end of the chapter you will see there is an internal consistency of star properties and that these points of light are very different from the other points of light that wander among them (the planets). Once we were able to measure the distances to the stars, we found that they are very luminous compared to the planets. There are like our Sun. We also discovered that there is a depth to our universe—the stars are not all at the same distance from us. And we found that the universe is a lot bigger than we thought before.
The stars are very luminous things like our Sun, but are they really like our Sun? Are they hot like the Sun? Temperature measurements show us that the stars are hot compared to the planets and more like the Sun. The red ones are cooler—only 2500 to 3500 K, the yellow ones are 5000 to 7000 K, the white ones are 9000 to 15,000 K, and the blue ones are 20,000 to 50,000 K. Are the stars large in diameter like the Sun? Size measurements show that the stars are big compared to the planets; they are large like the Sun. Things that are big and hot should also be massive like the Sun if they are like the Sun. Mass measurements show the stars do have a lot more material in them than the planets and are more like the Sun.
This chapter is the most math intensive of the chapters in this book (chapter 5 is the next most math intensive one), but remember to keep your eye on the “bigger picture”: how we know what we know and don’t get bogged down with the formulae. If your math skills are rusty, study the math review appendix and do not hesitate to ask for help. The vocabulary terms are in boldface.
11.2 Stars—What Are They Like?
11.2.1 Distances—Trigonometric Parallax
Unlike the other sciences, astronomy is entirely observational. You cannot run experiments on things. You cannot manipulate the objects to see how they work. In order to compare the objects you see from the Earth, you must first know how far away they are. Obviously, you cannot use a tape measure or send spacecraft out to the stars and measure how far they traveled. Bouncing radar off the surfaces of stars would not work because: (1) stars are glowing balls of hot gas and have no solid surface to reflect the radar beam back and (2) the radar signal would take years to just reach the nearest stars.
A favorite way to measure great distances is a technique used for thousands of years: look at something from two different vantage points and determine its distance using trigonometry. The object appears to shift positions compared to the far off background when you look at it from two different vantage points. The angular shift, called the parallax, is one angle of a triangle and the distance between the two vantage points is one side of the triangle. Basic trigonometric relations between the lengths of the sides of a triangle and its angles are used to calculate the lengths of all of the sides of the triangle. This method is called trigonometric parallax. Modern surveyors use this method to measure great distances, so the method is sometimes called “the surveyor’s method.”
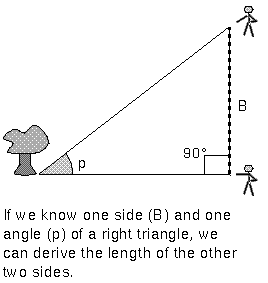
The side of the triangle between the observers, labelled “B” in the figure above, is called the baseline. The size of the parallax angle p is proportional to the size of the baseline. If the parallax angle is too small to measure because the object is so far away, then the surveyors have to increase their distance from each other. Ordinarily, you would have to use trigonometric functions like a tangent or a sine, but if the angle is small enough, you find a very simple relation between the parallax angle p, baseline B, and the distance d:
p = (206,265 × B)/d, where the angle p is measured in the tiny angle unit called an arc second. The farther away the object is, the less it appears to shift. Since the shifts of the stars are so small, arc seconds are used as the unit of the parallax angle. There are 3,600 arc seconds in just one degree. The ball in the tip of a ballpoint pen viewed from across the length of a football field is about 1 arc second.
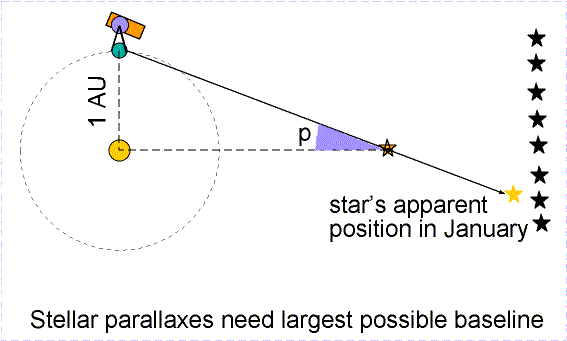
Trigonometric parallax is used to measure the distances of the nearby stars. The stars are so far away that observing a star from opposite sides of the Earth would produce a parallax angle much, much too small to detect. As large a baseline as possible must be used. The largest one that can be easily used is the orbit of the Earth. In this case the baseline is the distance between the Earth and the Sun—an astronomical unit (AU) or 149.6 million kilometers! A picture of a nearby star is taken against the background of stars from opposite sides of the Earth’s orbit (six months apart). The parallax angle p is one-half of the total angular shift.
However, even with this large baseline, the distances to the stars in units of astronomical units are huge, so a more convenient unit of distance called a parsec is used (abbreviated with “pc”). A parsec is the distance of a star that has a parallax of one arc second using a baseline of 1 astronomical unit. Therefore, one parsec = 206,265 astronomical units. The nearest star is about 1.3 parsecs from the solar system. In order to convert parsecs into standard units like kilometers or meters, you must know the numerical value for the astronomical unit—it sets the scale for the rest of the universe. Its value was not known accurately until the early 20th century (see the planetary science chapter). In terms of light years, one parsec = 3.26 light years.
Which unit should you use to specify distances: a light year or a parsec? Both are fine and are used by astronomers (including myself) all of the time, just as you may use “feet” and “yards” in everyday talk. However, when the parsec unit is used on this web site, the equivalent in light years will usually be given as well, but when the light year unit is used, the parsec equivalent will usually not be given. Using a parsec for the distance unit and an arc second for the angle, our simple angle formula above becomes extremely simple for measurements from Earth:
p = 1/d

Parallax angles as small as 1/50 arc second can be measured from the surface of the Earth. This means distances from the ground can be determined for stars that are up to 50 parsecs away. If a star is further away than that, its parallax angle p is too small to measure and you have to use more indirect methods to determine its distance. Stars are about a parsec apart from each other on average, so the method of trigonometric parallax works for just a few thousand nearby stars. The Hipparcos mission greatly extended the database of trigonometric parallax distances by getting above the blurring effect of the atmosphere. It measured the parallaxes of 118,000 stars to an astonishing precision of 1/1000 arc second (about 20 times better than from the ground)! It measured the parallaxes of 1 million other stars to a precision of about 1/20 arc seconds. Selecting the Hipparcos link will take you to the Hipparcos homepage and the catalogs.
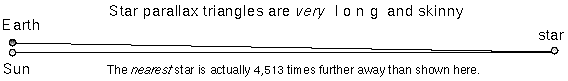
The actual stellar parallax triangles are much longer and skinnier than the ones typically shown in astronomy textbooks. They are so long and skinny that you do not need to worry about which distance you actually determine: the distance between the Sun and the star or the distance between the Earth and the star. Taking a look at the skinny star parallax triangle above and realizing that the triangle should be over 4,500 times longer (!), you can see that it does not make any significant difference which distance you want to talk about. If Pluto’s entire orbit was fit within a quarter (2.4 centimeters across), the nearest star would be 80 meters away! But if you are stubborn, consider these figures for the planet-Sun-star star parallax triangle setup above (where the planet-star side is the hypotenuse of the triangle):
| the Sun–nearest star distance = | 267,068.230220 AU = | 1.2948 pc; |
| the Earth–nearest star distance = | 267,068.230222 AU = | 1.2948 pc; |
| Pluto–nearest star distance = | 267,068.233146 AU = | 1.2948 pc! |
If you are super-picky, then yes, there is a slight difference but no one would complain if you ignored the difference. For the more general case of parallaxes observed from any planet, the distance to the star in parsecs d = ab/p, where p is the parallax in arc seconds, and ab is the distance between the planet and the Sun in AU.
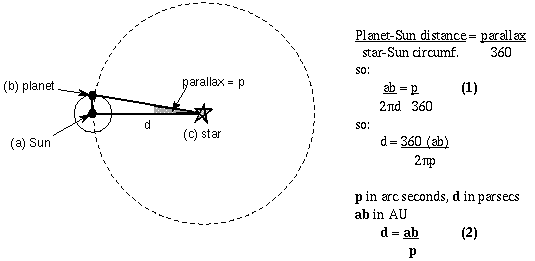
Formula (1) relates the planet-Sun baseline distance to the size of parallax measured. Formula (2) shows how the star-Sun distance d depends on the planet-Sun baseline and the parallax. In the case of Earth observations, the planet-Sun distance ab = 1 A.U. so d = 1/p. From Earth you simply flip the parallax angle over to get the distance! (Parallax of 1/2 arc seconds means a distance of 2 parsecs, parallax of 1/10 arc seconds means a distance of 10 parsecs, etc.)
A nice visualization of the parallax effect is the Distances to Nearby Stars and Their Motions lab (link will appear in a new window) created for the University of Washington’s introductory astronomy course. With this java-based lab, you can adjust the inclination of the star to the planet orbit, change the distance to the star, change the size of the planet orbit, and even add in the effect of proper motion.
Vocabulary
- astronomical unit
- parsec
- trigonometric parallax
Formulae
- small angle relation: angle p in arc seconds = (206,265 × B)/d. The baseline B and distance d must be in the same units of length.
- star parallax relation: parallax angle p in arc seconds = B / d. The baseline B is in units of A.U. and the distance d is in units of parsecs. For measurements from the Earth, B = 1.
- star distance d = B / p. For measurements from the Earth, B = 1.
Review Questions 1
- Describe the procedure used to find distances to the nearby stars.
- What do you need to know in order to get the scale of interstellar space in terms of kilometers or meters?
- If the star-Sun distance = 30 parsecs, how far is the star from the Earth?
- If you measure the parallax of a star to be 0.1 arc second on Earth, how big would the parallax of the same star be for an observer on Mars (Mars-Sun distance = 1.5 A.U.)?
- If you measure the parallax of a star to be 0.5 arc second on Earth and an observer in a space station in orbit around the Sun measures a parallax for the same star of 1 arc second, how far is the space station from the Sun?
- If you can measure angles as small as 1/50 arc second, how far out can you measure star distances from the Earth using the trigonometric parallax method? How long do you have to wait between observations?
- If you can measure angles as small as 1/50 arc second, how far out can you measure star distances from Jupiter (Jupiter-Sun distance = 5.2 A.U.) using the trigonometric parallax method? However, how long do you have to wait between observations? (Use Kepler’s third law to find Jupiter’s orbital period and divide by two.)
11.2.2 Distances—Inverse Square Law
When the direct method of trigonometric parallax does not work for a star because it is too far away, an indirect method called the Inverse Square Law of Light Brightness is used. This method uses the fact that a given star will grow dimmer in a predictable way as the distance between you and the star increases. If you know how much energy the star emits, then you can derive how far away it must be to appear as dim as it does. Stars become fainter with increasing distance because their energy is spread out over a larger and larger surface.
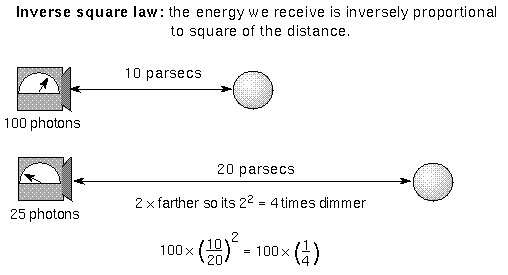
A star’s apparent brightness (its flux) decreases with the square of the distance. The flux is the amount of energy reaching each square centimeter of a detector (e.g., your eye, CCD, piece of the sphere) every second. Energy from any light source radiates out in a radial direction so concentric spheres (centered on the light source) have the same amount of energy pass through them every second. As light moves outward it spreads out to pass through each square centimeter of those spheres.
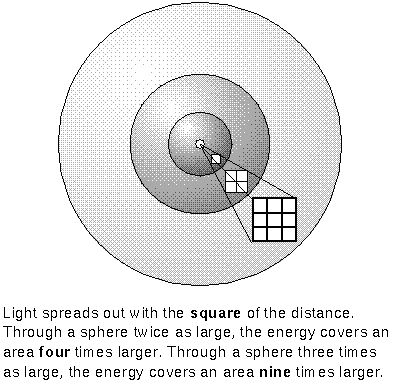
The same total amount of energy must pass through each sphere surface. Since a sphere has a surface area of 4π × (its radius)2, the flux of energy on sphere-1 = (the flux of energy on sphere #2) × [(sphere #2’s radius)/(sphere #1’s radius)]2. Notice that the radius for the reference flux (sphere #2) is on the top of the fraction while the radius for the unknown flux (sphere #1) is on the bottom—this is an inverse square law! As the distance INcreases, the flux DEcreases with the square of the distance. See the math review appendix for help on when to multiply and when to divide the distance factor.
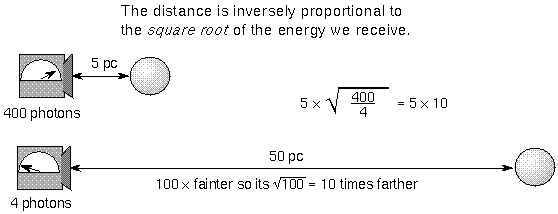
 Put another way: As the flux DEcreases, the star’s distance INcreases with the square root of the flux. If you know how much energy pours through the star’s surface and you measure how much energy you detect here on the Earth, then you can derive the star’s distance from you.
Vocabulary
- flux
- Inverse Square Law of Light Brightness
Formulae
- Inverse Square Law: Brightness at distance A = (brightness at distance B) × [(distance B)/(distance A)]2. Position (B) is the reference position.
- Unknown distance = reference distance × Sqrt[(reference flux)/(measured flux)].
Review Questions 2
- Two identical stars have different apparent brightnesses (fluxes). One star is 10 parsecs away from us and the other is 30 parsecs away from you. Which star is brighter and by how many times?
- Two identical stars have different fluxes. One star is 5 parsecs away from you and appears 81 times brighter than the other star. How far away is the dimmer star?
- The Earth receives about 1380 Watts/meter2 of energy from the Sun. How much energy does Saturn receive from the Sun (Saturn-Sun distance = 9.5 A.U.)? (A Watt is a unit for the amount of energy generated or received every second.)
11.2.3 Magnitude System
The brightness of stars are specified with the magnitude system. The Greek astronomer Hipparchus devised this system around 150 B.C.E. He put the brightest stars into the first magnitude class, the next brightest stars into second magnitude class, and so on until he had all of the visible stars grouped into six magnitude classes. The dimmest stars were of sixth magnitude. The magnitude system was based on how bright a star appeared to the unaided eye.
By the 19th century astronomers had developed the technology to objectively measure a star’s brightness. Instead of abandoning the long-used magnitude system, astronomers refined it and quantified it. They established that a difference of 5 magnitudes corresponds to a factor of exactly 100 times in intensity. The other intervals of magnitude were based on the 19th century belief of how the human eye perceives differences in brightnesses. It was thought that the eye sensed differences in brightness on a logarithmic scale so a star’s magnitude is not directly proportional to the actual amount of energy you receive. Now it is known that the eye is not quite a logarithmic detector.
Your eyes perceive equal ratios of intensity as equal intervals of brightness. On the quantified magnitude scale, a magnitude interval of 1 corresponds to a factor of 1001/5 or approximately 2.512 times the amount in actual intensity. For example, first magnitude stars are about 2.5122-1 = 2.512 times brighter than 2nd magnitude stars, 2.512×2.512 = 2.5123-1 = 2.5122 times brighter than 3rd magnitude stars, 2.512×2.512×2.512 = 2.5124-1 = 2.5123 times brighter than 4th magnitude stars, etc. (See the math review appendix for what is meant by the terms “factor of” and “times.”) Notice that you raise the number 2.512 to a power equal to the difference in magnitudes.
Also, many objects go beyond Hipparchus’ original bounds of magnitude 1 to 6. Some very bright objects can have magnitudes of 0 or even negative numbers and very faint objects have magnitudes greater than +6. The important thing to remember is that brighter objects have smaller magnitudes than fainter objects. The magnitude system is screwy, but it’s tradition! (Song from Fiddler on the Roof could be played here.)
11.2.3.1 Apparent Magnitude
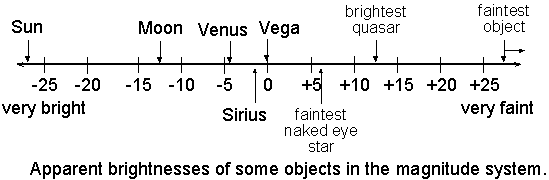
The apparent brightness of a star observed from the Earth is called the apparent magnitude. The apparent magnitude is a measure of the star’s flux received by us. Here are some example apparent magnitudes: Sun = -26.7, Moon = -12.6, Venus = -4.4, Sirius = -1.4, Vega = 0.00, faintest naked eye star = +6.5, brightest quasar = +12.8, faintest object = +30 to +31.
How do you do that?Star A has an apparent magnitude = 5.4 and star B has an apparent magnitude = 2.4. Which star is brighter and by how many times? Star B is brighter than star A because it has a lower apparent magnitude. Star B is brighter by 5.4 – 2.4 = 3 magnitudes. In terms of intensity star B is 2.512(5.4-2.4) = 2.5123.0 = approximately 15.8 times brighter than star A. The amount of energy you receive from star B is almost 16 times greater than what you receive from star A. |
11.2.3.2 Absolute Magnitude and Luminosity
If the star was at 10 parsecs distance from us, then its apparent magnitude would be equal to its absolute magnitude. The absolute magnitude is a measure of the star’s luminosity—the total amount of energy radiated by the star every second. If you measure a star’s apparent magnitude and know its absolute magnitude, you can find the star’s distance (using the inverse square law of light brightness). If you know a star’s apparent magnitude and distance, you can find the star’s luminosity (see the table below). The luminosity is a quantity that depends on the star itself, not on how far away it is (it is an “intrinsic” property). For this reason a star’s luminosity tells you about the internal physics of the star and is a more important quantity than the apparent brightness.
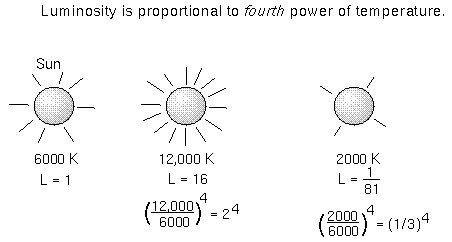
A star can be luminous because it is hot or it is large (or both!). The luminosity of an object = the amount of energy every square meter produces multiplied by its surface area. Recall from the electromagnetic radiation chapter that the amount of energy pouring through every square meter = σ × (object’s surface temperature)4, where σ is the Stefan-Boltzmann constant. Because the temperature is raised to the fourth power, it means that the luminosity of a star increases very quickly with even slight increases in the temperature.
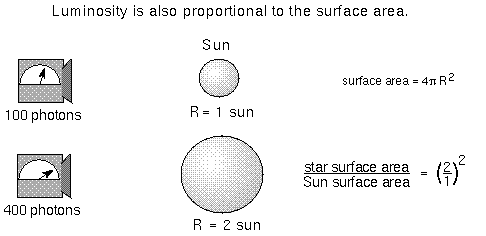
Because the surface area is also in the luminosity relation, the luminosity of a bigger star is larger than a smaller star at the same temperature. You can use the relation to get another important characteristic of a star. If you measure the apparent brightness, temperature, and distance of a star, you can determine its size.
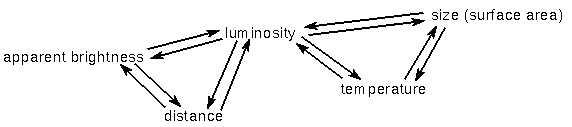
The figure below illustrates the inter-dependence of measurable quantities with the derived values that have been discussed so far. In the left triangular relationship, the apparent brightness, distance, and luminosity are tied together such that if you know any two of the sides, you can derive the third side. For example, if you measure a glowing object’s apparent brightness (how bright it appears from your location) and its distance (with trigonometric parallax), then you can derive the glowing object’s luminosity. Or if you measure a glowing object’s apparent brightness and you know the object’s luminosity without knowing its distance, you can derive the distance (using the inverse square law). In the right triangular relationship, the luminosity, temperature, and size of the glowing object are tied together. If you measure the object’s temperature and know its luminosity, you can derive the object’s size. Or if you measure the glowing object’s size and its temperature, you can derive the glowing object’s luminosity—its electromagnetic energy output.
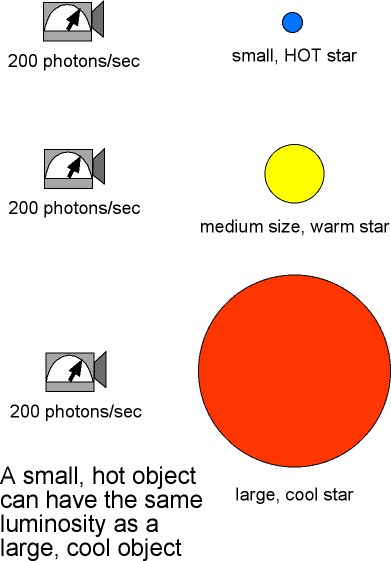
Finally, note that a small, hot object can have the same luminosity as a large, cool object. So if the luminosity remains the same, an increase in the size (surface area) of the object must result in a DEcrease in the temperature to compensate.
Most famous apparently bright stars are also intrinsically bright (luminous). They can be seen from great distances away. However, most of the nearby stars are intrinsically faint. If you assume we live in a typical patch of the Milky Way Galaxy (using the Copernican principle), then you deduce that most stars are puny emitters of light. The bright stars you can see in even the city are the odd ones in our galaxy! The least luminous stars have absolute magnitudes = +19 and the brightest stars have absolute magnitudes = -8. This is a huge range in luminosity! See the “How do you do that?” box below the following table for examples of using the apparent and absolute magnitudes to determine stellar distances and luminosities of stars.
Even the intrinsically faintest star’s luminosity is much, much greater than all of the power we generate here on the Earth so a “watt” or a “megawatt” are too tiny a unit of power to use for the stars. Star luminosities are specified in units of solar luminosity—relative to the Sun (so the Sun generates one solar luminosity of power). One solar luminosity is about 4 × 1026 watts.
Magnitudes and Distances for some well-known Stars (from the precise measurements of the Hipparcos mission)
| Star | App.Mag.* | Distance(pc) | Abs.Mag.* | Visual Luminosity(rel. to Sun)** |
|---|---|---|---|---|
| Sun | -26.74 | 4.84813×10⁻⁶ | 4.83 | 1 |
| Sirius | -1.44 | 2.6371 | 1.45 | 22.5 |
| Arcturus | -0.05 | 11.25 | -0.31 | 114 |
| Vega | 0.03 | 7.7561 | 0.58 | 50.1 |
| Spica | 0.98 | 80.39 | -3.55 | 2250 |
| Barnard’s Star | 9.54 | 1.8215 | 13.24 | 1/2310 |
| Proxima Centauri | 11.01 | 1.2948 | 15.45 | 1/17700 |
*magnitudes measured using “V” filter, see the next section.
**The visual luminosity is the energy output in the “V” filter. A total luminosity (“bolometric luminosity”) would encompass the energy in all parts of the electromagnetic spectrum.
11.2.4 Color and Temperature
Stars are dense hot balls of gas so their spectra similar to that of a perfect thermal radiator, which produces a smooth continuous spectrum. (Although, stars are not perfect thermal radiators, their spectra are similar enough to the smooth continuous spectrum for what follows.) Therefore, the color of stars depends on their temperature—hotter stars are bluer and cooler stars are redder. You can observe the star through different filters to get an approximate temperature. A filter allows only a narrow range of wavelengths (colors) through. By sampling the star’s spectrum at two different wavelength ranges (“bands”), you can determine if the spectrum is that for a hot, warm, cool, or cold star. Hot stars have temperatures around 60,000 K while cold stars have temperatures around 3,000 K. The filter diagrams are shown below.
11.2.4.1 Color Index and Temperature
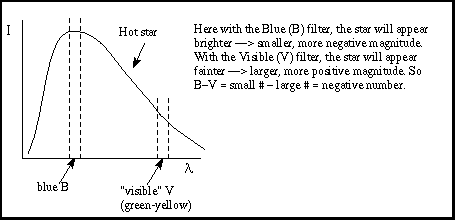
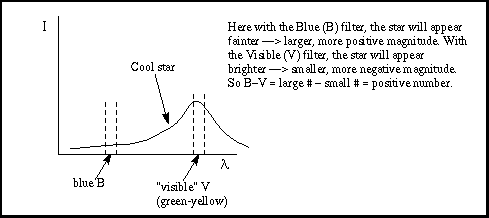
Hot stars appear bluer than cooler stars. Cooler stars are redder than hotter stars. The “B-V color index” is a way of quantifying this using two different filters; one a blue (B) filter that only lets a narrow range of colors or wavelengths through centered on the blue colors, and a “visual” (V) filter that only lets the wavelengths close to the green-yellow band through.
A hot star has a B-V color index close to 0 or negative, while a cool star has a B-V color index close to 2.0. Other stars are somewhere in between. Here are the steps to determine the B-V color index:
- Measure the apparent brightness (flux) with two different filters (B, V).
- The flux of energy passing through the filter tells you the magnitude (brightness) at the wavelength of the filter.
- Compute the magnitude difference of the two filters, B – V.
The UNL Astronomy Education program’s Blackbody Curves and UBV Filters module lets you explore the relationship between temperature and the thermal spectrum by manipulating various parameters with a graphical interface (link will appear in a new window). You can also explore temperature-color correlation using various filters.
11.2.4.2 Wien’s Law and Temperature
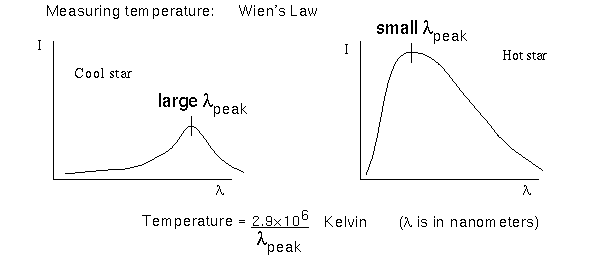
Another way to measure a star’s temperature is to use Wien’s law described in the Electromagnetic Radiation chapter. Cool stars will have the peak of their continuous spectrum at long (redder) wavelengths. As the temperature of a star increases, the peak of its continuous spectrum shifts to shorter (bluer) wavelengths. The final way to measure a star’s temperature is more accurate than the previous two methods. It uses the strength of different absorption lines in a star’s spectrum. It is described in full a little later in the chapter. The temperatures of different types of stars are summarized in the Main Sequence Star Properties table.
Sections Review
Vocabulary
- absolute magnitude
- apparent magnitude
- filter
- luminosity
- magnitude
- solar luminosity
Formulae
- Luminosity = (surface area of star) × flux of energy through its surface. This is: [4π × (star’s radius)2] × [σ × (star’s surface temperature)4], where σ is the Stefan-Boltzmann constant.
- Star A brightness = star B brightness × 2.512(mag B – mag A). Star B is the reference star.
Review Questions 3
- What does a magnitude interval of 5 correspond to in brightness? How about an interval of 1? How about an interval of 3?
- Do bright things have larger or smaller magnitudes than fainter things?
- How is apparent magnitude different from absolute magnitude?
- Put the following objects (given with their apparent magnitudes) in order of brightness as seen from Earth (faintest first): Sun (-26.7), Venus (-4.4), Barnard’s Star (9.5), Sirius (-1.4), Proxima Centauri (11.0).
- You receive 8× 10⁻⁹ Watts/meter2 of energy from a star 2 parsecs away with an apparent magnitude = 1.3. What is the energy you receive from an identical star with an apparent magnitude = 5.3?
- Two stars are identical, but star B is 10X farther away than star A. What is the difference in magnitudes between the two stars?
- What two things does luminosity depend on?
- If our Sun has luminosity= 1 solar luminosity, what is the luminosity of the following stars if they have the same diameter as the Sun (fill in the table):
star temperature (K) luminosity Sun 6,000 1 A 12,000 B 2,000 C 36,000 - Some stars have temperatures of only 3000 K but have over 100X more luminosity than the Sun. How is this possible?
- Would a red giant have a smaller or larger magnitude in a “V” filter than in a “B” filter? (Remember the first rule of magnitudes!)
11.2.5 The Composition of Stars
The compositions of stars are determined through spectroscopy. Spectroscopy is the study of something using spectra. Recall from the Electromagnetic Radiation chapter that a spectrum is what results when you spread starlight out into its individual colors. By noting what absorption lines (or sometimes, emission lines) are present and their strengths, you can find out a tremendous amount of information. Stars have absorption lines patterns similar to the Sun. This means that they are composed mostly of hydrogen and helium with traces of other elements.
From these absorption lines you learn some important things besides the star’s composition:
- Structure of stars: From the simple fact that you see absorption lines in most stellar spectra, you know that the stars must have a hot dense part that produces a continuous spectrum and an outer layer, or atmosphere, made of cooler, low density gas. The general trend is density and temperature of stars decreases as the distance from the star’s center increases. The hot dense part is also gaseous because of the extreme temperatures. Stars have no molten rock in them like the interiors of some of the planets. The next two things have already been noted elsewhere but they are important enough to state again.
- Universality of physical laws: The same pattern of hydrogen lines are seen in the in spectra of the Sun, stars, distant galaxies, and quasars (active galaxies at very great distances from us). This is a sensitive test of whether or not the laws of physics used in the structure of atoms works everywhere in the universe. Even slight differences in the rules of quantum mechanics that govern the interactions of the protons, electrons, and neutrons or differences in the strengths of the fundamental forces of natures from that observed on the Earth would produce noticeable changes in the spacing and strength of the spectral lines. If the subatomic particles had different amount of charge or mass, the pattern of lines would be different than what you see on the Earth. Because the same patterns are seen in the spectra, regardless of where the light comes from, the physics used on Earth must work everywhere else in the universe! All of the absorption lines seen in celestial objects can be seen in laboratories on Earth. The charge and mass of the electron and proton are the same everywhere you look. Physical laws are the same everywhere!
- Permanence of physical laws: Since light has a finite speed and the distances are vast, the light received from very distant galaxies and quasars has been traveling for billions of years. The light from those remote regions tells us about the physical laws way back then. The spectra seen can be explained with the same physical laws in operation here on Earth at the present time. Physical laws are the same throughout time!
11.2.6 The Velocities of Stars
The velocity of stars are determined by using the Doppler effect (see the Doppler effect section). The motion of a star causes a shift in the wavelengths received. The star emits the same spectrum it would emit if it was at rest. The pattern of lines depends on the internal physics of the star itself. The Doppler effect depends on the external property of the star’s motion through space relative to us. The wavelength shift Δλ = λnew – λrest, where λnew is the observed wavelength and λrest is the wavelength you would observe if the star was not moving relative to us. The amount of the shift depends on the velocity of the star in this way: Δλ / λrest = (radial velocity) / c, where c is the speed of light and the radial velocity is the component of the star’s motion that is along the line of sight. Rearranging the terms you find the radial velocity = (Δλ / λrest) × c.
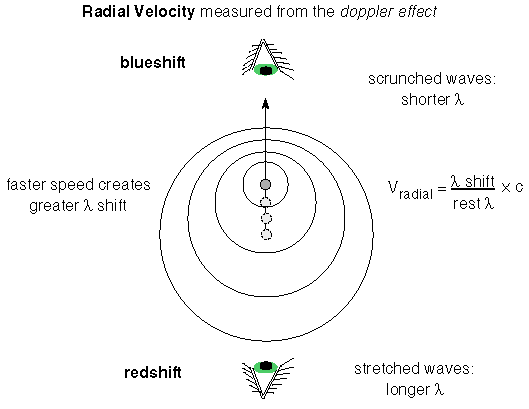
If the star is moving away from you, then you see the wavelengths stretched out and Δλ is a positive number. The spectral lines appear shifted to the red end of the spectrum, so the shift is called a redshift. If the star is moving toward you, then the wavelengths appear to the compressed and Δλ is a negative number. The spectral lines are shifted to the blue end of the spectrum, so the shift is called a blueshift. The Doppler effect tells you only about the motion relative to you. If you move toward the star or it moves toward you, the Doppler effect will be the same. The Earth is in motion relative to the star because it are orbiting the Sun, so you have to take the Earth’s orbital motion into account when figuring the star’s velocity from the Doppler effect.
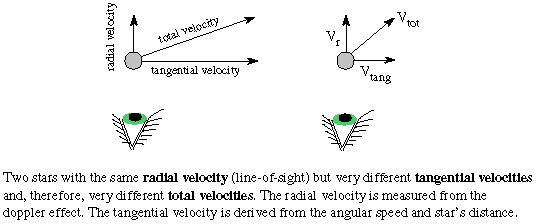
Also, the Doppler effect gives you only the speed along the line of sight. Most stars move at an angle to our line of sight. The part of a star’s total velocity that is perpendicular to the line of sight is called the tangential velocity.
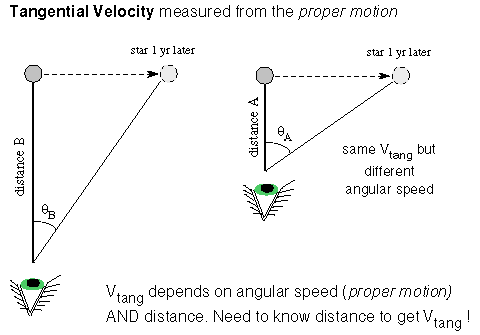
To get the tangential velocity, you need to first measure the angular velocity of the star across the sky (dθ/dt). This is how many degrees on the sky the star moves in a given amount of time and is called the proper motion by astronomers. If you determine the star’s distance from its trigonometric parallax or the inverse square law method, you can convert the angular velocity (proper motion) to tangential velocity in physical units such as kilometers/second. The tangential velocity = k × the star’s distance × the proper motion, where k is a conversion factor that will take care of the conversion from arc seconds and parsecs and years to kilometers/second. Using the Pythagorean theorem for right triangles, you find that the star’s total velocity = Sqrt[(radial velocity)2 + (tangential velocity)2].
Sections Review
Vocabulary
- blueshift
- Doppler effect
- proper motion
- radial velocity
- redshift
- spectroscopy
- tangential velocity
Formulae
- redshift: Δλ > 0. Object moving away from you.
- blueshift: Δλ < 0. Object moving toward you.
- Radial velocity = (Δλ/ λrest) × c, where Δλ is the Doppler shift, λrest is the wavelength you would see if the star was at rest. The rest wavelength is also the wavelength of light emitted by the star. Larger Doppler shift means greater radial velocity.
- Tangential velocity = k × (the star’s distance) × (dθ/dt), where k is a conversion factor and (dθ/dt) is the angular velocity or proper motion of the star.
- Total velocity = Sqrt[(radial velocity)2 + (tangential velocity)2]
Review Questions 4
- How is spectroscopy used to find the composition of stars?
- How do scientists know that the laws of physics are the same everywhere in the Galaxy and have been the same for billions of years?
- How does the amount of Doppler shift in the spectral lines depend on the relative speed? How does the direction of shift of the spectral lines depend on the direction of motion?
- Given three stars moving with the same total speed of 40 kilometers/second but in three different directions: (A) moving away at an angle=45° from our line of sight, (B) moving directly away from us, (C) moving perpendicular to our line of sight, put the stars in order of increasing amount of shift you see in their spectral lines (the smallest shift first).
- The H-alpha spectral line is at 656.3 nanometers. Star (A) has that line at 656.8 nanometers, star (B) has that line at 656.0 nanometers, star (C) has that line at 656.3 nanometers. Which star is moving the fastest (along the line of sight) and what is the three stars’ directions of motion?
- What must you first know about a star before you can convert its angular velocity to a tangential velocity in kilometers/second?
- Two stars have proper motions of 0.5 arc seconds/year. Star (A) is 20 parsecs away and star (B) is 30 parsecs away. Which one is moving faster in space?
- Two stars orbit about a common point in a plane that is oriented parallel to our line of sight. What will you see happening to the spectral lines of each star? If there is a change, will both stars’ spectra be changing in the same direction at the same time?
11.2.7 The Masses of Stars
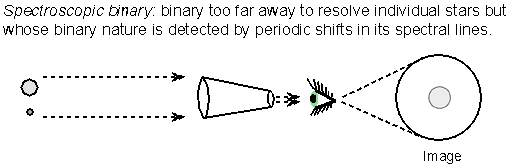
To determine the masses of stars, Kepler’s third law is applied to the motions of binary stars—two stars orbiting a common point. The greater the combined mass of the two stars, the greater the gravity acceleration is, and, therefore, the smaller their orbital period. A majority of the several hundred billion stars in the Galaxy are in a system with two or more stars orbiting each other. Usually the binary stars are spectroscopic binary stars. A spectroscopic binary system is two stars orbiting a common point at too great a distance away from us to resolve the two stars individually, but whose binary nature is indicated in the periodic shift of their spectral lines as they orbit around each other. Spectroscopic binary stars are used because (a) there are a lot more far away stars than nearby ones and (b) more importantly, you can easily measure their speeds from the Doppler shifted lines.
Newton’s form of Kepler’s third law gives the combined mass of the two stars: (mass 1 + mass 2) = (separation distance)3/(orbital period)2 if you use solar mass units, the A.U. for the distance unit between the stars, and the time unit of years for the orbital period. The total distance between the two stars is used in Kepler’s third law, but their individual distances from the common point they orbit is used to determine the stars’ individual masses.
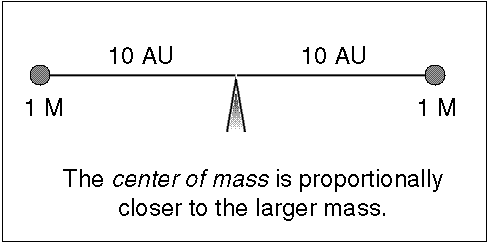
Since stars have about the same mass (within a factor of 20), they both orbit around a common point, called the center of mass, that is significantly different from one of the star’s center. The center of mass (C.M.) is the point where (mass star 1) × (C.M. distance 1) = (mass star 2) × (C.M. distance 2), or the point they would be balanced upon if the stars were on a stellar seesaw (it is the “x” in the figure below). The massive star is proportionally closer to the center of mass than the low-mass star and the massive star also moves proportionally slower than the low-mass star so its spectral lines have a smaller Doppler shift.
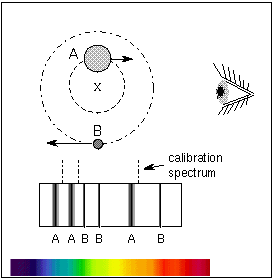
Newton’s Law of Gravity with Newton’s second law of motion explains why this is. Both stars are experiencing the same gravity force between them [since (mass star 1) × (mass star 2) = (mass star 2) × (mass star 1)]. Given the same gravity force at work between the two stars, the lower-mass star will experience a greater acceleration than the more massive star (which star would be like Andre the Giant and which would be like Tom Thumb?). The lower-mass star moves faster and has a larger orbit. The more massive star’s orbital speed is less and its orbit is smaller so that the two stars always stay on opposite sides of the center of mass. The two stars inside the binary system have the same orbital period around the center of mass.
Note of caution about comparisons: When comparing two separate binary systems of the same separation distance, the two stars in the binary system that has larger combined mass will move faster than the two stars in the binary system with less combined mass. The larger combined mass binary has greater gravity force acting between the two stars. When comparing the two stars within a particular binary system, the larger mass star will move slower than the less massive star. The gravity force acting on the two stars within the binary is the same for both of the stars.
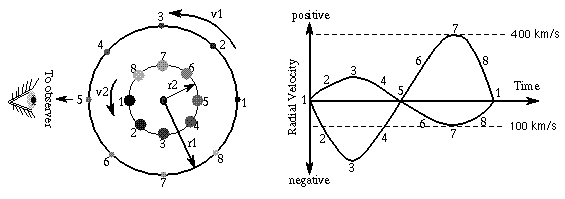
The distance traveled by an object = velocity × the time it takes. The distance traveled by the star is just the circumference of the orbit = 2π × the radius of a circular orbit and something similar for an elliptical orbit. Therefore, each star’s C.M.-distance r = the star’s velocity × the star’s orbital period / (2π). This allows you to use the easily measured velocity in Kepler’s third law and in the center of mass relations. The Doppler shifts of the spectral lines are used to construct a radial velocity curve—a plot of the radial velocity (line of sight velocity) vs. time. The low-mass star will move proportionally faster than the massive star. Note that the two stars will have the same orbital period but the less massive star will have a larger orbit around the center of mass point, so it will have to move faster to compensate—both stars remain directly opposite each other as they orbit the center of mass with the center of mass always in between them.
Uncertainty arises, though, if the binary orbital plane is inclined to our line of sight by an angle amount i. In that very common case, the radial velocity = total velocity × sin(inclination angle). The orbit’s inclination angle i ranges from i=0° for a face-on orbit (viewing the orbit from directly above the system) to i=90° for an edge-on orbit (viewing the orbit along its plane). The inclination angle can be approximately determined from the plot of radial velocity vs. time. If the binary is an eclipsing binary, then you know that i=90° because you see them periodically pass in front of each other. Eclipsing binaries also allow us to accurately determine the diameters of stars (discussed in the next section). The radial velocity measurement technique has also been used to find planets around other stars and to locate black holes from the Doppler shifts they produce in the visible stars they orbit around.

Remember these rules:
- Stars stay on the opposite side of the center of mass from each other.
- The massive star moves slower than the low-mass star.
- The center of mass is also the point where mass1 × velocity1 = mass2 × velocity2
Using the distance of the center of mass from each star, you can proportion out the total mass to each star. Here are the steps to figure out each star’s mass:
- Find the total mass (mass star A + mass star B) from Kepler’s 3rd law.
- Find the proportion of each star’s mass to the total mass from the center of mass: (mass star A)/(mass star B) = (C.M. distance B)/(C.M. distance A) or (mass star A)/(mass star B) = (velocity star B)/(velocity star A). Note which star’s values are on top of the fraction and which are on the bottom! Simplify the fraction down as far as possible.
- If you set the mass of star A = (mass of star B)×(the fraction of the previous step) and substitute this for the mass of star A in the first step (Kepler’s 3rd law step), you will find star B’s mass = the total mass/(1 + the fraction from step 2).
- Star A’s mass = star B’s mass × (the fraction from step 2).
- Check that the proportions add up to the total mass!
(By the way, you can use this proportion idea in cooking if you need to have a 32-ounce mixture and the recipe calls for 3 parts sugar to 2 parts flour or if a recipe is for 6 people but you need to serve 8 people.) The masses of different types of stars are summarized in the Main Sequence Star Properties table below.
Use the UNL Astronomy Education program’s Eclipsing Binary Simulator to further explore how the orbits of the stars in a binary star system change with different proportions of the masses (link will appear in a new window). “Eclipsing binaries” are discussed further in the next section of Astronomy Notes.
Even the smallest star’s mass is much, much greater than a planet’s so a “kilogram” is too tiny a unit of mass to use for the stars. Star masses are specified in units of solar mass—relative to the Sun (so the Sun has one solar mass of material). One solar mass is about 2 × 1030 kilograms.
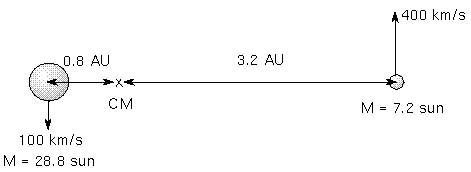
How do you do that?Use the observed velocities in the figure below to find the individual masses of the stars. The stars have a measured period of 4/3 years and a separation distance of 4 A.U.
|
One final caution: There is a difference between the mass of a star and its size (diameter)! Just because something is large in size (diameter) does not necessarily mean that it is more massive. Some stars are very large in diameter but have less mass than much smaller stars. For example, in the future, our Sun will become a red giant about 100 times larger in diameter than it is now, but it will have less mass than it does now. It will eventually become a white dwarf about the diameter of the Earth and that tiny white dwarf will be more massive than the much larger diameter ordinary “red dwarf M stars” discussed in a later section.
Vocabulary
- center of mass
- radial velocity curve
- spectroscopic binary
- solar mass
Formulae
- Center of mass distance: mass star A / mass star B = distance B / distance A, where the distances are each measured from the center of mass. Notice which star’s distance is in the top of the fraction!
- separation distance = distance A + distance B, where the distances are each measured from the center of mass.
- Center of mass velocity: mass star A / mass star B = velocity star B / velocity star A. Notice which star’s velocity is in the top of the fraction!
- Kepler’s 3rd law: (mass star A + mass star B) = (separation distance)3 / (orbital period)2 if using solar mass units, A.U. for the distance unit between the stars, and the time unit of years for the orbital period.
Review Questions 5
- How are the masses of stars found? What kind of star systems are used and which famous law of orbital motion is used?
- How many times closer to the center of mass is the massive star than the low-mass star?
- How do you use the radial velocity curve to find the mass proportions and separation distance? How much faster or slower does the low-mass star move than the massive star?
- Consider three binary systems with a separation of 2 A.U. between the two stars in each system. System (1) has the two stars orbiting the center of mass in 1 year, system (2) has the two stars orbiting the center of mass in 5 months, and system (3) has the two stars orbiting the center of mass in 2 years. Put the binary systems in the correct order by increasing total mass (least massive first and ignore the inclination angle i).
- Star A is 0.2 A.U. from the center of mass and its companion star B is 0.6 A.U. from the center of mass. Which star is more massive?
- If the two stars in the previous question have orbital periods of 0.35777 years, what are the individual masses of the two stars? (Hint: find their combined mass from Kepler’s third law and then use their relative center of mass distances to find how many times more massive one star is than the other.)
- Use the radial velocity curve graph in the text above. Assume that star A reaches a velocity of 90 kilometers/second and star B reaches only 10 kilometers/second. If the separation distance = 10 A.U., and the orbital period = 10 years, what is the combined mass of the two stars? From the center of mass relation also find (star A mass)/(star B mass) and their individual masses.
- For which star system(s) would you be able to measure the radial velocity: (a) stars orbiting in a plane that is along our line of sight (i=0°); (b) stars orbiting in a plane that is perpendicular to our line of sight (face-on, i=90°); (c) stars orbiting in a plane with i=30°.
11.2.8 The Sizes of Stars
All but a few stars appear as mere pinpoints in even the largest telescopes. They are much too far away to derive their diameters from measuring their angular diameters and distances. Eclipsing binaries are used to determine indirectly the diameters of stars. These are two stars orbiting each other in a plane that is parallel to your line of sight so you see their orbits edge-on. This means that one star will periodically cover up the other star. During the eclipse the total brightness measured for the binary will decrease. The amount of the dip in brightness depends on the luminosity and relative size of the two stars.
A star’s diameter is found from speed = (distance traveled)/(time it takes). The speed comes from the Doppler shift and the time is the length of the eclipse. The distance traveled during the eclipse is equal to the diameter of the star = 2 × radius. The light curve—plot of brightness vs. time—is used to derive the star diameters. Here is an example of two stars orbiting each other in circular orbits seen edge-on with one star small and hot and the other large and cool:
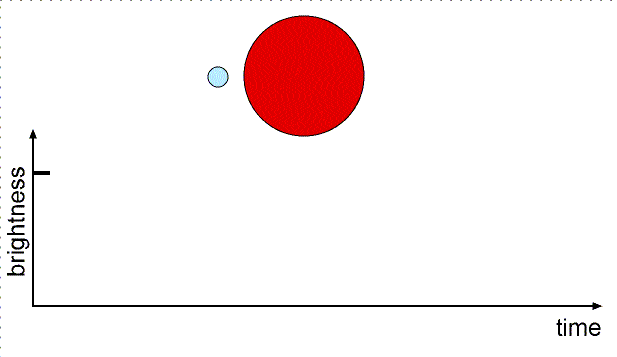
When the small star moves from position 1 to position 2 (or from position 3 to position 4), it has moved a distance equal to its diameter. When the small star moves from position 1 to position 3 (or from position 2 to position 4), it has moved a distance equal to the diameter of the large star.
Star sizes can also be found (less accurately) from the luminosity and the flux. Recall from the magnitude section above that the luminosity = [4π×(star radius)2] × [σ×(star’s surface temperature)4], where σ is the Stefan-Boltzmann constant. If you compare the star with the Sun, you can cancel out the constants to get (star’s radius)/(Sun’s radius) = (Sun’s temperature/star’s temperature)2 × Sqrt[star’s luminosity/Sun’s luminosity]. See the “How do you do that?” box below for an example. The sizes of different types of stars are summarized in the Main Sequence Star Properties table below.
How do you do that?Antares is 9120 times more luminous than the Sun (Antares’ luminosity/Sun’s luminosity)= 9120) and has a temperature of only 3340 K and the Sun’s temperature is 5840 K. Antares’ size/Sun’s size = (5840/3340)2 × Sqrt[9120] = 3.057 × 95.5 = 292. Antares is almost 300 times the size of the Sun! If the Sun were replaced by Antares, the inner planets Mercury, Venus, and Earth would be inside Antares! It is a red giant star—a star close to death. |
Try other scenarios of the star sizes and star masses with the UNL Astronomy Education program’s Eclipsing Binary Simulator (link will appear in a new window). You can adjust the star masses, sizes, temperatures and separations and orbit inclination and eccentricity to see how the light curve changes.
Vocabulary
- light curve
- eclipsing binary
Formulae
- Eclipsing binary: diameter = speed × time of eclipse.
- Size from luminosity: star’s radius/Sun’s radius = (Sun’s temperature/star’s temperature)2 Sqrt[star’s luminosity/Sun’s luminosity].
Review Questions 6
- How do you use the light curve to find the diameters of stars?
- What special type of binary star system is used to find the diameters of stars?
- Use the light curve in the figure in the section above. Assume that when star A is behind star B, the small dip in brightness is seen. When star B is behind star A, the big dip in brightness is seen. Which star is more luminous?
- From the previous problem, if t1 = 45 minutes, t2 = 60 minutes, t3 = 105 minutes, t4 = 120 minutes, what is (star A diameter)/(star B diameter)?
- From the previous problem, if the velocity is 750 kilometers/second, what is the diameter of the larger star in kilometers and solar units? (The Sun’s radius = 695,500 kilometers.)
- The white dwarf Sirius B has a temperature of 25,200 K and a luminosity only 0.026 times the Sun’s luminosity. What is the diameter of Sirius B in solar units and kilometers?
11.3 Types of Stars and the HR Diagram
This section presents the results of using the tools described above. In order to get a better idea of what stars are like, put them into groups of some sort. Then you can see how the other quantities differ among the various groups. Astronomers group stars into general types based on their temperature. Temperature is chosen because the color of a star depends on the temperature and color is a easily seen characteristic, regardless of the distance.
However, using color as a temperature probe gives only a crude measurement of the star’s temperature. Astronomers use another method of determining the temperature more accurately. It uses the strength of different absorption lines in a star’s spectrum. Once astronomers developed this method, they began to look for correlations of temperature with other quantities such as mass, size, and luminosity in the hope that the underlying physical principles of stars could be understood. But are the stars you easily see from Earth typical of other stars in other parts of the universe? You will see how that important question can be answered.
11.3.1 Temperature Dependence of Absorption Lines
The strength and pattern of the absorption lines does vary among the stars. Some stars have strong (dark) hydrogen lines, other stars have no hydrogen lines but strong calcium and sodium lines. Are their abundances different? No. When scientists learned more about the physics of the atom, they discovered that the temperature of the star’s photosphere determines what pattern of lines you will see. Because of this, you can determine the temperature of a star from what pattern of absorption lines you see and their strength. As a way to check this, the spectra from all of the gas clouds from which stars form show approximately the same abundances everywhere.
Before reading further, you will need to have a good grasp of the concepts in the atomic structure part of the light chapter. Please review the last half of the light chapter first before continuing so that you will understand what follows.
While the temperature does not change the energy levels of an atom—they are fixed, the temperature certainly does affect how many electrons are in which energy levels. Measuring the strength of the hydrogen absorption lines is usually the first step for determining a star’s temperature. If the star is too hot or too cold, the hydrogen lines will be weak. To produce strong, dark hydrogen lines, the star’s temperature must be within a certain range. To produce a hydrogen absorption line in the visible (optical) band of the electromagnetic spectrum, the atom’s electron must be in the second energy level when it absorbs a photon. If the temperature is too high, most of the hydrogen atoms will have their electrons starting out at higher energy levels. If the temperature is too low, most of the hydrogen atoms will have their electrons starting out from the ground state.
If the hydrogen atoms are heated to high temperatures, the atomic collisions can ionize the hydrogen atoms. If there are no electrons bound to the nuclei, there are no hydrogen absorption lines. If the star’s temperature is too low, then there are few electrons in the second energy level. Most of the electrons are in the ground state because there are not that many atomic collisions.
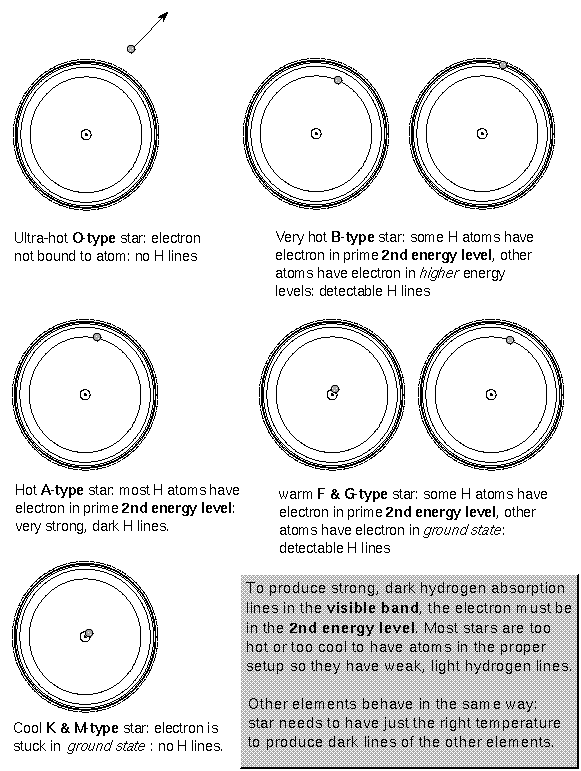
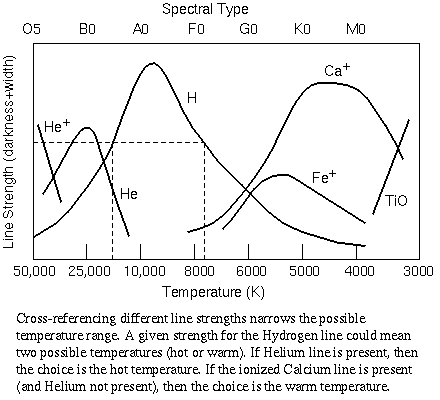
Hydrogen lines will be strong for temperatures = 4,000 to 12,000 K. Helium atoms hang onto their electrons more strongly and, therefore, require higher temperatures of 15,000 to 30,000 K to produce absorption lines in the visible band. Calcium atoms have a looser hold on their electrons so calcium lines are strong for cooler temperatures of 3000 to 6000 K. The strengths of each element’s absorption lines are sensitive to the temperature. A given strength of an element’s lines will give you either two possible temperatures for the star or a range of possible temperatures. But using two or more element’s line strengths together narrows the possible temperature range. Cross-referencing each elements’ line strengths gives an accurate temperature with an uncertainty of only 20 to 50 K. This technique is the most accurate way to measure the temperature of a star.
Use the UNL Astronomy Education program’s Hydrogen Energy Levels module to further explore how the number of atoms in a given state (number of electrons in a given state) changes with temperature (link will appear in a new window).
A star’s temperature found from the continuous spectrum is not as accurate. One reason for this is that some stars have the peaks of their continuous spectrum outside of the visible band so you cannot use Wien’s law (see the Wien’s Law section) to determine the temperature. Also, stars are not perfect thermal radiators, so the continuum spectrum (Wien’s law) gives only a rough temperature (within a few hundred Kelvin). The spectral lines seen for different types of stars are summarized in the Main Sequence Star Properties table below.
11.3.2 Spectral Types
Stars are divided into groups called spectral types (also called spectral classes) which are based on the strength of the hydrogen absorption lines. The A-type stars have the strongest (darkest) hydrogen lines, B-type next strongest, F-type next, etc. Originally there was the whole alphabet of types, based on hydrogen line strengths, but then astronomers discovered that the line strengths depended on the temperature.Also, the discussion in the previous section and the figure above show that more than just the hydrogen lines must be used because a very hot star and a cool star can have the same hydrogen lines strength. The presence of other atomic or ion lines are used in conjunction with the hydrogen spectrum to determine the particular temperature of the star.
After some rearranging and merging of some classes, the spectral type sequence is now OBAFGKM when ordered by temperature. The O-type stars are the hottest stars and the M-type stars are the coolest. Each spectral type is subdivided into 10 intervals, e.g., G2 or F5, with 0 hotter than 1, 1 hotter than 2, etc. About 90% of the stars are called main sequence stars. The other 10% are either red giants, supergiants, white dwarfs, proto-stars, neutron stars, or black holes. The characteristics of these types of stars will be explored in the following chapters. The table below gives some basic characteristics of the different spectral classes of main sequence stars. Notice the trends in the table: as the temperature of the main sequence star increases, the mass and size increase. Also, because of the relation between luminosity and the size and temperature of a star, hotter main sequence stars are more luminous than cooler main sequence stars. However, there are limits to how hot a star will be, or how massive and large it can be. Understanding why the constraints exist is the key to understanding how stars work.
| Color | Class | solar masses | solar diameters | Temperature | Prominent Lines |
|---|---|---|---|---|---|
| bluest | O | 20 – 100 | 12 – 25 | 40,000 | ionized helium |
| bluish | B | 4 – 20 | 4 – 12 | 18,000 | neutral helium, neutral hydrogen |
| blue-white | A | 2 – 4 | 1.5 – 4 | 10,000 | neutral hydrogen |
| white | F | 1.05 – 2 | 1.1 – 1.5 | 7,000 | neutral hydrogen, ionized calcium |
| yellow-white | G | 0.8 – 1.05 | 0.85 – 1.1 | 5,500 | neutral hydrogen, strongest ionized calcium |
| orange | K | 0.5 – 0.8 | 0.6 – 0.85 | 4,000 | neutral metals (calcium, iron), ionized calcium |
| red | M | 0.08 – 0.5 | 0.1 – 0.6 | 3,000 | molecules and neutral metals |
Red giants can get up to about 50 times the size of the Sun. Supergiants are between 20 times the size of the Sun for the B0 supergiants and 1000 times the size of the Sun for the M0 supergiants. Despite the tremendous size of some stars, even the largest supergiant is only 1/7000 light years across. Since stars are several light years from each other, they do not collide with each other (even the fat ones!).
Vocabulary
- main sequence
- spectral type
Review Questions 7
- What is the main reason why some stars have strong (dark) hydrogen lines and others have weak (light) H lines?
- Why do very hot stars have no hydrogen lines?
- Why do very cool stars have no hydrogen lines?
- What is the grouping of stars by spectral type based on?
- A star of spectral type A has the strongest hydrogen lines. What is its temperature?
- Two stars have equal strengths of their hydrogen lines. Star A has lines from helium present while star B has lines of ionized calcium present. Which star is hotter? Explain your reasoning.
- What are two reasons why determining a star’s temperature from Wien’s law (see the Electromagnetic Radiation chapter) is usually not as accurate as using the spectral lines?
- What are the 7 basic spectral types in order of temperature (hottest to coldest)?
- If our Sun has a surface temperature of 5840 K, how many times hotter than the Sun is the hottest O-type star? How many times cooler than the Sun is the coolest M-type star?
- What fraction of the stars are main sequence stars?
- What is the range of temperatures found on the surface of main sequence stars?
- What is the range of luminosities produced by main sequence stars? Compare them to the Sun (Watts are ridiculously small energy units to use).
- What is the range of diameters for main sequence stars? Compare them to the Sun (miles and kilometers are ridiculously small length units to use). Red giants, supergiants, white dwarfs are not main sequence stars.
- What is the trend in the stellar diameters vs. temperature for main sequence stars? (As temperature increases, the diameter _________.)
- What is the trend in the stellar luminosities vs. temperature for main sequence stars? (As temperature increases, the luminosity _________.)
- What is the likelihood that even the largest supergiant stars will run into another star (of any size)?
- What is the range of stellar masses for main sequence stars? Compare them to the Sun (pounds and kilograms are ridiculously small mass units to use).
- What is the trend in the stellar masses vs. temperature for main sequence stars? (As temperature increases, the mass _________.)
- What is the trend in the stellar masses vs. luminosity for main sequence stars? (As luminosity increases, the mass _________.)
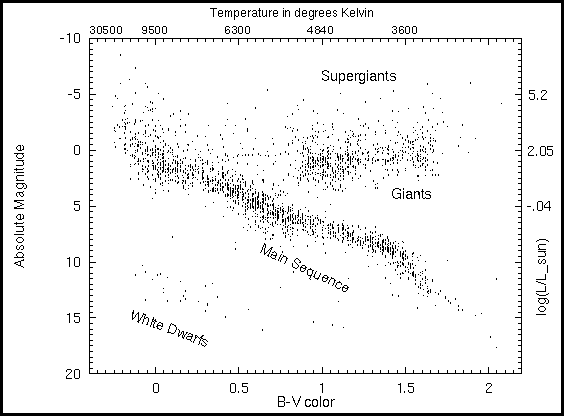
11.3.3 Hertzsprung-Russell Diagram
In order to better understand how stars are constructed, astronomers look for correlations between stellar properties. The easiest way to do this is make a plot of one intrinsic property vs. another intrinsic property. An intrinsic property is one that does not depend on the distance the star is from the Earth (e.g., temperature, mass, diameter, composition, and luminosity). By the beginning of the 20th century, astronomers understood how to measure these intrinsic properties. In 1912, two astronomers, Ejnar Hertzsprung (lived 1873–1967) and Henry Norris Russell (lived 1877–1957), independently found a surprising correlation between temperature (color) and luminosity (absolute magnitude) for 90% of the stars. These stars lie along a narrow diagonal band in the diagram called the main sequence. This plot of luminosity vs. temperature is called the Hertzsprung-Russell diagram or just H-R diagram for short.
Before this discovery astronomers thought that it was just as easy for nature to make a hot dim star as a hot luminous star or a cool luminous one or whatever other combination you want. But nature prefers to make particular kinds of stars. Understanding why enables you to determine the rules nature follows. A correlation between mass and luminosity is also seen for main sequence stars: Luminosity = Mass3.5 in solar units.
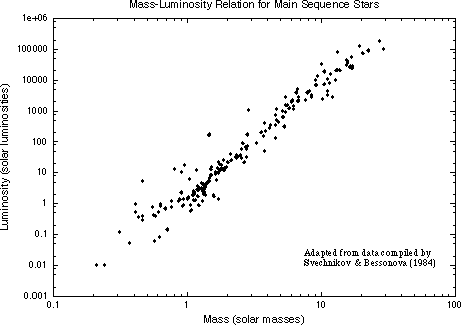
The mass-luminosity relation for 192 stars in double-lined spectroscopic binary systems.The hot, luminous O-type stars are more massive than the cool, dim M-type stars. The mass-luminosity relationship tells about the structure of stars and how they produce their energy. The cause of the mass-luminosity relation will be explored further in the next chapter.
The other ten percent of the stars in the H-R diagram do not follow the mass-luminosity relationship. The giant and supergiant stars are in the upper right of the diagram. These stars must be large in diameter because they are very luminous even though they are cool. They have a huge surface area over which to radiate their energy. The white dwarfs are at the opposite end in the lower left of the diagram. They must be very small in diameter (only about the diameter of the Earth) because even though they are hot, they are intrinsically dim. They have a small surface area and so the sum of the total radiated energy is small.
The H-R diagram is also called a color-magnitude diagram because the absolute magnitude is usually plotted vs. the color. The H-R diagram below is for all stars visible to the naked eye (down to apparent magnitude = +5) plus all stars within 25 parsecs. Luminous stars are easier to observe because they can be seen from great distances away but they are rarer in the galaxy. They tend to reside in the top half of the H-R diagram. Faint stars are harder to see but they are more common in the galaxy. They tend to reside in the bottom half of the H-R diagram.
Use the UNL Astronomy Education program’s Hertzsprung-Russell Diagram module for another in-depth tutorial on the HR diagram via a graphical interface (link will appear in a new window).
11.3.4 Spectroscopic Parallax
You can use the correlation between luminosity and temperature (spectral type) for main sequence stars to get their distances. This method is called spectroscopic parallax because a distance is found from knowledge of a star’s spectral type. Distances for stars too far away to show a detectable trigonometric parallax are found this way. Here are the steps you use to find a star’s distance using the spectroscopic parallax method:
- Determine the star’s spectral type from spectroscopy and measure the star’s apparent brightness (flux).
- Use a calibrated main sequence to get the star’s luminosity. The Hyades cluster in the Taurus constellation is the standard calibrator.
- Use the Inverse Square Law for Brightness to get the distance: unknown distance = calibrator distance × Sqrt[calibrator flux/unknown star’s flux.]
How do you do that?A G2 star appears 25 times dimmer than it would if it was at the standard distance of 10 parsecs used for the absolute magnitude. The G2 star is at a distance of = 10 × Sqrt[1/(1/25)] = 10 × Sqrt[25/1] = 50 parsecs from us. |
Distances to red giant and supergiant stars are found in a similar way but you need to investigate their spectra more closely to see if they are the very large stars you think they are. Their position in the calibrated H-R diagram is found and their apparent brightness gives you the distance. Also, this process can be used to find the distance of an entire cluster. The entire color-magnitude diagram for the cluster is compared with a calibration cluster’s color-magnitude diagram. The calibration cluster is a known distance away. Some adjustments for the cluster’s age and composition differences between the stars in the cluster and the calibration cluster must be made. Such fine-tuning adjustments are called “main-sequence fitting.”
11.3.5 What is a “Typical” Star?
The Sun is often said to be an “average” or “typical” middle-aged star. What is “average” depends on how you choose your sample!
- Compared to the nearby stars, the Sun is luminous, hot, and big.
- Compared to the apparently bright stars, the Sun is dim, cool, and small.
- Compared to the stars in globular clusters, the Sun is very young.
- Compared to the stars in open (galactic) clusters, the Sun is very old.
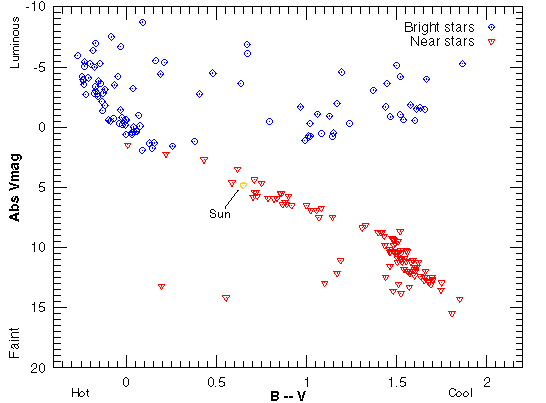
If you picked stars at random from our galaxy, what would they tend to look like? How the stars are selected can give you very different answers of what a typical star is like. The figure below shows where the 100 apparently brightest stars in our sky would be plotted and where the 100 nearest stars would be plotted on the H-R diagram. Both data sets are from the Hipparcos survey. The stars that appear bright in our sky also are intrinsically luminous for the most part. They are the diamonds in the diagram. The near stars are all within 7.63 parsecs of the Sun. They are plotted with the upside-down triangles. A great majority of the near stars are cool and faint.
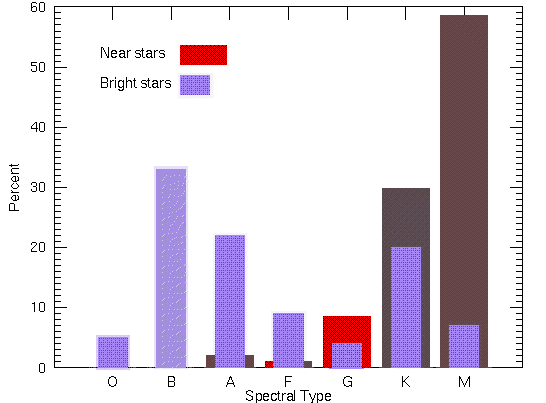
Another way to compare them is to plot the proportions of the spectral types for each group. As shown in the figure below, most of the apparently bright stars are the hot and luminous A and B-type stars. The sample includes a few of the very hot O-type stars. All but one of the K-type stars in the bright star sample are giants or supergiant stars. All of the M-type stars are giants or supergiants.
The graph for the near star sample looks very different: the majority of stars are the cool and faint K and M-type stars. Only one star in the entire sample is a giant star. The rest are main sequence stars.
Which of these samples is more representative of the entire population of stars in our galaxy? A representative sample includes all parts of the population of the objects your are investigating in their proper proportions. The relative proportion of common things will be greater than the relative proportions of rare things. In fact, the uncommon things may not be found in a small representative sample because they are so rare!
A poorly selected sample that is unrepresentative of the larger set can lead to biased results. Such biases can be found in any sample of objects or people. Public officials and politicians who base their decisions on what the polls say people believe or think about different issues, are usually working with biased samples of opinions. The pollsters will interview between 1000 to 2000 people across the nation and from that set, they get an idea of what the entire nation of several hundred million people believe. They get accurate results only if they have a sample of people that properly represents the entire population. It is extremely difficult (if not impossible) to get a representative sample for political polls. The situation for astronomy is easier and standard statistical methods can be used to find a representative sample of stars.
In our example of the types of stars, the bright star sample is very biased. The average distance between each star in the bright star sample is about 20 times greater than the average distance between each star in the near star sample. This gives us a rough idea of how spread out the luminous stars and faint stars are—the luminous stars are much more spread out than the cool faint stars. Therefore, in a given volume of space, there will be many more cool faint stars than luminous stars. The faint stars cannot be seen from the great distances the luminous stars are seen, so a sample based on the apparent brightness biases against the very numerous faint stars.
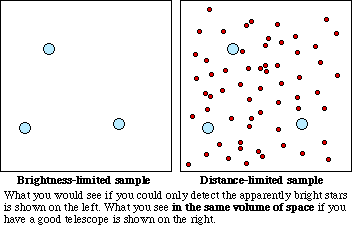
The situation is analogous to using meshes of different spacings between the mesh lines for sifting pieces of minerals on a beach. A coarse mesh with large spacings between the mesh lines will let the sand fall through so all you get are the large rocks. The sample of minerals you would get with the coarse mesh would be just the rare large rocks. A fine mesh with narrow gaps between the mesh lines will collect all the sand grains and the large rocks. The sample of minerals you would get with the fine mesh would be all of the pieces of mineral (sand + rocks) in that plot of beach and you would reach a much more accurate conclusion of the proportion of small mineral chunks (sand grains) to large mineral chunks (large rocks).
Sections Review
Vocabulary
- color-magnitude diagram
- Hertzsprung-Russell diagram
- representative sample
- spectroscopic parallax
Review Questions 8
- How it is known that luminosity and temperature are correlated for about 90% of the stars?
- Where are luminous and faint stars plotted in the H-R diagram (color-magnitude diagram)? Where are cool and hot stars plotted?
- Where are red giants, main sequence stars, and white dwarfs plotted in the H-R diagram?
- Which main sequence stars are hotter and which are cooler? Which ones are more massive and which ones are the lightweights?
- Which main sequence stars are bigger in diameter than others? How can we tell that they are bigger?
- What is the relation between stellar luminosity and stellar mass?
- Which spectral classes are more common than others? How do you know without having to survey the entire galaxy?
- Of the two ways of selecting stars, grouping by proximity or by apparent brightness, which gives you a representative sample of stars? Why is the other way a biased way of selecting stars?
- If you wanted to find an accurate proportion of the galaxies that are faint and the proportion of the galaxies that are luminous, should you select all galaxies within a certain volume of space or all galaxies above a certain apparent brightness? Explain why!
- Which telescope should you use if you want to get a more accurate proportion of faint stars to luminous stars: a 15-centimeter objective telescope or 90-centimeter objective telescope? Explain why!
