
This chapter was copied with permission from Nick Strobel’s Astronomy Notes. Go to his site at www.astronomynotes.com for the updated and corrected version.
Other Galaxies and Active Galaxies
This chapter covers: the characteristics of other normal galaxies, active galaxies, and finding distances to other galaxies (this includes the distance-scale ladder). Also, large-scale structure is covered (galaxy clusters and collisions and superclusters).
15.1 Introduction
Using large telescopes you can see clouds of dust and gas inside the Galaxy. You can also see other peculiar milky nebulae scattered among the stars. Some of these milky nebulae have spiral shapes to them and others look like squashed spheres or tortured messes of material. Three of the milky nebulae are visible as fuzzy patches to the naked eye: one is in the constellation Andromeda and two others (called the Large and Small Magellanic Clouds after the first European explorer to see them, Ferdinand Magellan) are in the southern sky in the constellations Mensa and Hydrus.
 Edwin Hubble (courtesy of OCIW) Edwin Hubble (courtesy of OCIW) |
 Milton Humason (courtesy of OCIW) Milton Humason (courtesy of OCIW) |
Work by Edwin Hubble (lived 1889–1953) and Milton Humason (lived 1891–1972) in the 1920s established that each of the spiral nebulae was another huge star system, called a galaxy (from the Greek “galactos,” meaning “milk”), outside our own galaxy. Telescopes of sufficient size to have the needed resolution to see individual stars in the other galaxies were used by Hubble and Humason to measure the distances to the galaxies. This chapter covers the galactic systems outside our own and a peculiar group of galaxies that produce a large amount of energy in their centers. The vocabulary terms are in boldface.
15.2 Other Galaxies
Galaxies are organized systems thousands to hundreds of thousands of light years across made of tens of millions to trillions of stars sometimes mixed with gas and dust all held together by their mutual gravity. There is not some unfortunate astronomer counting up all the stars in the galaxies. You can quickly get an estimate of the number of stars in a galaxy by dividing the total luminosity of the galaxy by a typical star’s luminosity. A more accurate value would result if you use the galaxy’s luminosity function (a table of the proportion of stars of a given luminosity). Or you could divide the total mass of the galaxy by a typical star’s mass (or use the mass function to get the proportions right).
The distances between galaxies are large and are often measured in megaparsecs. A megaparsec is one million parsecs (or about 3.3 million light years). For instance, the distance between the Milky Way and the closest large galaxy, the Andromeda Galaxy, is about 0.899 megaparsecs. There was a big controversy in the 1910s and early 1920s over whether the nebulae called galaxies were outside the Milky Way or were part of it. There was so much controversy that the National Academy of Sciences held a debate between the opposing sides in 1920. Those favoring a large Milky Way with the spiral nebulae inside it were represented by Harlow Shapley. Those favoring the spiral nebulae as separate groups of stars outside the Milky Way were represented by Heber Curtis. The Shapley-Curtis debate did not decide much beyond the fact that both sides had powerful evidence for their views.
Edwin Hubble and Milton Humason set out to resolve the debate by using the largest telescope at the time, the 100-inch telescope on Mount Wilson, to study the large spiral nebula in the Andromeda constellation. Because of its large mirror, the telescope had sufficient resolving power and light-gathering power to spot individual stars in the Andromeda Galaxy. In the mid-1920s they discovered Cepheid variables in the galaxy and used the period-luminosity relation to find that the distance to the galaxy was very much greater than even the largest estimates for the size of the Milky Way. Galaxies are definitely outside the Milky Way and our galaxy is just one of billions of galaxies in the universe.
Their discovery continued the process started by Copernicus long ago of moving us from the center of the universe. It is ironic that the person who moved the Sun from the center, Harlow Shapley, would be the one to hold fast to our galaxy being the center of the universe. Scientists are humans with all of the greatness and foibles that comes with being human. Despite our prejudices, nature and experiments will always ultimately show us the truth about the physical universe.
15.2.1 Types of Galaxies
Edwin Hubble divided the galaxies into three basic groups: ellipticals, spirals, and irregulars. The ellipticals are smooth and round or elliptical, the spirals are flat with a spiral pattern in their disk, and the irregulars have stars and gas in random patches. Most galaxies are small and faint so only the luminous galaxies are seen at great distances. These spectacular galaxies tend to be either the elliptical or spiral type, so they are the ones often displayed in astronomy textbooks.
In 1936 Hubble put these groups onto a two-pronged sequence that looks like a tuning fork because he thought that the galaxies started out as ellipticals, then changed to spirals and then to irregulars. In this scenario, a galaxy could take one of two paths. It could take the top prong and be a regular spiral where the arms come right out of the galaxy center, or it could take the bottom prong and be a barred spiral with the arms starting from the ends of a bar of gas and stars going through the center. The ellipticals are sub-divided by how round they are and the spirals are sub-divided by how loose their arms are and how big their nucleus is.

Astronomers now know that it is NOT an evolutionary sequence because each type of galaxy has very old stars. The oldest stars in any galaxy all have about the same age of around 13 billion years. This means that spirals form as spirals, ellipticals form as ellipticals, and irregulars form as irregulars. However, the “tuning fork” diagram is still used to classify galaxies because of its convenience.
15.2.1.1 Ellipticals
Elliptical galaxies are smooth and elliptical in appearance. There are four distinguishing characteristics of the ellipticals: (a) they have much more random star motion than orderly rotational motion (star orbits are aligned in a wide range of angles and have a wide range of eccentricities); (b) they have very little dust and gas left between the stars; (c) this means that they have no new star formation occurring now and no hot, bright, massive stars in them (those stars are too short-lived); and (d) they have no spiral structure.
Elliptical galaxies are sub-classified according to how flat they are. The number next to the “E” in the tuning fork diagram = 10 × (largest diameter – smallest diameter) / (largest diameter), so an E7 galaxy is flatter than an E0 galaxy. The flattened shape is not due to rotational flattening but to how the orbits are oriented and the distribution of the star velocities. Most ellipticals are small and faint. The dwarf ellipticals may be the most common type of galaxy in the universe (or maybe the dwarf irregulars are). Examples of elliptical galaxies are M32 (an E2 dwarf elliptical next to the Andromeda Galaxy) and M87 (a huge elliptical in the center of the Virgo cluster). The image sequence below starting from from top left and moving clockwise: Messier 32 (E2 satellite of Andromeda Galaxy), Messier 87 (a huge elliptical at the center of the Virgo cluster), Leo I (=UGC 5470, E3 dwarf elliptical in Local Group), Messier 110 (another satellite of Andromeda Galaxy, E6 type).
 Messier 32: a dwarf elliptical (E2) satellite galaxy of the Andromeda Galaxy. Courtesy of NOAO/AURA/NSF Messier 32: a dwarf elliptical (E2) satellite galaxy of the Andromeda Galaxy. Courtesy of NOAO/AURA/NSF |
 Messier 87: giant elliptical (E1) at the Virgo Cluster’s core. It has grown very large by “eating” other galaxies. Messier 87: giant elliptical (E1) at the Virgo Cluster’s core. It has grown very large by “eating” other galaxies. |
 Leo I: dwarf elliptical (E3) in the Local Group. Leo I: dwarf elliptical (E3) in the Local Group. |
 Messier 110: dwarf elliptical (E6) satellite galaxy of the Andromeda Galaxy. Courtesy of Bill Schoening, Vanessa Harvy/REU program/NOAO/AURA/NSF—cropped from their M 31 image)) Messier 110: dwarf elliptical (E6) satellite galaxy of the Andromeda Galaxy. Courtesy of Bill Schoening, Vanessa Harvy/REU program/NOAO/AURA/NSF—cropped from their M 31 image)) |
15.2.1.2 Spirals
Spiral galaxies have flattened disks with a spiral pattern in the disk. The spiral arms can go all of the way into the bulge or be attached to the ends of a long bar of gas and dust that bisects the bulge. The four distinguishing characteristics of the spirals are: (a) they have more orderly, rotational motion than random motion (the rotation refers to the disk as a whole and means that the star orbits are closely confined to a narrow range of angles and are fairly circular); (b) they have some or a lot of gas and dust between the stars; (c) this means they can have new star formation occurring in the disk, particularly in the spiral arms; and (d) they have a spiral structure.
Spiral galaxies are sub-classified into “a,” “b,” “c,” and “d” groups according to how loose their spiral arms are and how big the nucleus is. The “a” group spirals have large bulges and very tightly wound spiral arms and the “d” group spirals have almost no bulge and very loose arms. The Milky Way is between the “b” and “c” groups with a bar, so it is an SBbc-type spiral galaxy. Most spirals are luminous. Some other examples of spiral galaxies are M31 (the Andromeda Galaxy) and M33 (a small spiral in the Local Group).
Some disk galaxies have no spiral arms and are called “S0” (“SB0” if there is a bar) or lenticular galaxies. They are placed at the point in the tuning fork diagram where it branches off to the regular spiral or barred spiral pattern prong. Their gas and dust may been blown away by the galaxy moving quickly through the low-density intergalactic medium (hot, very thin gas between the galaxies) or used up in a rapid burst of star formation.
The sequence of images below starting from top left and moving clockwise: the Andromeda Galaxy (=Messier 31, note M32 above it and M110 below it), Triangulum Galaxy (=Messier 33, small spiral in the Local Group), NGC 2997 (Sc grand-design spiral, may be barred), NGC 3351 (=Messier 95, SBb type), NGC 1365 (SBbc type, note looser arms), NGC 3031 (=Messier 81, Sb type, note it has a larger nucleus than NGC 2997 and tighter arms).
 The Andromeda Galaxy (=M 31): a large spiral galaxy (Sb) near the Milky Way. Note M 32 just above it and M 110 below it. Courtesy of Jason Ware The Andromeda Galaxy (=M 31): a large spiral galaxy (Sb) near the Milky Way. Note M 32 just above it and M 110 below it. Courtesy of Jason Ware |
 The Triangulum Galaxy (=M 33): a small spiral galaxy (Scd) in the Local Group. The Triangulum Galaxy (=M 33): a small spiral galaxy (Scd) in the Local Group. |
 Messier 81: a large spiral galaxy (Sb). Courtesy of NOAO/AURA/NSF) Messier 81: a large spiral galaxy (Sb). Courtesy of NOAO/AURA/NSF) |
 NGC 2997: a large face-on spiral galaxy (Sc). NGC 2997: a large face-on spiral galaxy (Sc). |
 NGC 1365: a barred spiral galaxy (SBbc). NGC 1365: a barred spiral galaxy (SBbc). |
 NGC 3351 (=M 95): a barred spiral galaxy (SBb). NGC 3351 (=M 95): a barred spiral galaxy (SBb). |
15.2.1.3 Irregulars
Irregular galaxies have no definite structure. The stars are bunched up but the patches are randomly distributed throughout the galaxy. Some irregulars have a lot of dust and gas so star formation is possible. Some are undergoing a burst of star formation now, so many H II regions are seen in them. Others have very little star formation going on in them (even some of those with a lot of gas and dust still in them).
Most irregulars are small and faint. The dwarf irregulars may be the most common type of galaxy in the universe (or maybe the dwarf ellipticals are). The estimates of the number of dwarf irregulars and dwarf ellipticals are based on the proportions of these types of galaxies in nearby groups. The dwarf galaxies far away are too faint to be seen and are, therefore, overlooked in surveys of the sky. Perhaps if the dwarf galaxies were brighter, Hubble would have arranged the galaxies in a different sequence instead of the two-pronged sequence. Examples of irregular galaxies are the Large and Small Magellanic Clouds (two small irregulars that orbit the Milky Way).
The sequence of images below starting from top left: the Large Magellanic Cloud (satellite of Milky Way), the Small Magellanic Cloud (satellite of Milky Way), IC 5152 (irregular in Local Group), NGC 3084 (=Messier 82, starburst irregular in M81 group), NGC 1313 (another starburst galaxy), NGC 6822 (irregular in Local Group).
 Large Magellanic Cloud: a dwarf irregular satellite galaxy of the Milky Way. Large Magellanic Cloud: a dwarf irregular satellite galaxy of the Milky Way. |
 Small Magellanic Cloud: a dwarf irregular satellite galaxy of the Milky Way. Small Magellanic Cloud: a dwarf irregular satellite galaxy of the Milky Way. |
 NGC 6822: a dwarf irregular galaxy in the Local Group. NGC 6822: a dwarf irregular galaxy in the Local Group. |
 IC 5152: a dwarf irregular galaxy in the Local Group. IC 5152: a dwarf irregular galaxy in the Local Group. |
 NGC 1313: a starburst galaxy also called a barred spiral galaxy (SBc). NGC 1313: a starburst galaxy also called a barred spiral galaxy (SBc). |
 Messier 82: a starburst galaxy. Messier 82: a starburst galaxy. |
15.2.2 Positions On Our Sky
Galaxies are distributed fairly uniformly across the sky. Approximately the same number of galaxies are seen in every direction you look except for a narrow 5 to 10 degree band along the Milky Way’s mid-plane. That narrow band, called the “zone of avoidance,” is created by the dust in the disk. The galaxies along that line-of-sight would be visible if the dust were not there. Radio waves are not affected by the dust and radio surveys show that there are, in fact, galaxies in the direction of the Milky Way’s mid-plane.

The distribution of galaxies is not perfectly smooth. They clump together into loose groups. If you focus on just the galaxy positions on the sky, you get just a two-dimensional picture. Finding the distances to the galaxies allows you to get a three-dimensional view of the galaxy positions. Three-dimensional maps of the universe have revealed surprisingly large structures in the universe. Galaxies like to group together and those groups, in turn, congregate together.
Sections Review
Vocabulary
- elliptical galaxy
- irregular galaxy
- spiral galaxy
Review Questions 1
- What is a typical size of a galaxy? What is a typical number of stars in a galaxy? How do you know? What holds them all together?
- What separates a cluster of stars from a galaxy?
- What are four basic distinguishing characteristics between a spiral galaxy and an elliptical galaxy? What kind of galaxy do we live in?
- What is the most common type of galaxy? How does their proportion in the universe compare with the proportion of them shown in astronomy books? Explain any differences there may be.
- Why are irregular galaxies called irregulars?
- Why do you see more galaxies when you look in a direction perpendicular to the Galactic plane than when you look along Galactic plane?
15.2.3 Distances to Galaxies
Just like you found for the determination of stellar properties, finding the distances to the galaxies is essential for comparing the galaxies against each other. In order to determine the luminosities and masses of the galaxies and the distribution of the mass inside the galaxies, you must first know the distances to them. Is that galaxy in our telescope bright because it is producing a lot of energy or because it is close to us? Are the stars moving quickly in a galaxy because the combined mass is large or because the distances inside the galaxy are small? You need to find the distance to the galaxy to be sure.
One method of determining the distance discussed above uses the period-luminosity relation of Cepheid variable stars to derive the distance from the apparent brightness of the Cepheids. This works for the nearby galaxies. To find the distance to galaxies farther away, other standard candle techniques involving objects more luminous than Cepheids like Type Ia supernova explosions or supergiant stars are used. Supergiant luminosities are not as well known or uniform as the Type Ia supernovae, so astronomers prefer to use the Type Ia supernovae to derive the distances to the very distant galaxies.
Another method uses the width of a galaxy’s spectral lines. The width of the absorption lines from the stars or the radio emission lines from the gas in a galaxy depend on the amount of stellar motion in the galaxy. Most galaxies are too far away for us to resolve the fine-scale details of the internal motions in the galaxies. The spectrum of far away galaxies is from the combined motions of all of the material in them.

Some stars in a far away galaxy are moving toward us, so their absorption lines will be blueshifted. Other stars will have redshifted lines because they are moving away from us. The resulting spectral lines from the entire galaxy blend together to form a FAT line. The same effect is seen with the gas motions (caused by heat and rotation) inside a single star or gas cloud in our galaxy. The more random motion there is in an elliptical galaxy, the greater the spread in the distribution of velocities and the fatter the resulting galaxy spectral lines will be. More massive galaxies have more gravity so their stars are accelerated to faster orbital speeds. More massive galaxies should have broader lines and if the luminosity correlates with the mass, the more massive galaxies should have greater luminosity.
Sandra Faber and Robert Jackson discovered in 1976 a simple relation between the spread of velocities (called the velocity dispersion) and the luminosity of elliptical galaxies. For the inner few kiloparsecs of the elliptical galaxies, the velocity dispersion = 220 × (L/L*)0.25, where L* is a characteristic galaxy luminosity (around 10 billion solar luminosities). This is known as the Faber-Jackson relation. An elliptical galaxy’s luminosity can be found from the velocity dispersion of the stars in the central few kiloparsecs of the galaxy.

In 1977 Brent Tully and Richard Fisher discovered a similar relation between the rotational velocity of the disk and the luminosity of a spiral galaxy. The rotational velocity is found from the 21-cm emission of the neutral atomic hydrogen gas in the outer parts of the disk. The rotation curve is flat in the outer parts of most galactic disks (dark matter!). The part of a spiral galaxy’s disk that is rotating toward us will have its lines blueshifted. The part of the disk rotating away from us will have its lines redshifted. The 21-cm emission from a galaxy of small angular size will be the blended result of the emission from all parts of the disk. The faster the disk rotates, the broader the 21-cm emission line will be. The Tully-Fisher relation for the infrared luminosity is: circular velocity = 220 × (L/L*)0.22. Infrared is used to lessen the effect of the dust in our galaxy and in the other spiral galaxy. The luminosity of the galaxy is found from the width of the 21-cm emission line and the distance is then derived using the apparent brightness and the inverse square law. The methods of determining the distances to the galaxies are summarized in the “Steps to the Hubble Constant” section.
15.2.4 Hubble Law
In 1914 Vesto Slipher (lived 1870–1963) announced his results from the spectra of over 40 spiral galaxies (at his time people thought the “spiral nebulae” were inside the Milky Way). He found that over 90% of the spectra showed redshifts which meant that they were moving away from us. Edwin Hubble and Milton Humason found distances to the spiral nebulae. When Hubble plotted the redshift vs. the distance of the galaxies, he found a surprising relation: more distant galaxies are moving faster away from us. Hubble first announced his findings at the National Academy of Sciences in 1929 and then Hubble and Humason followed up with a peer-reviewed article in the widely-read Astrophysical Journal in 1931: the recession speed = H × distance, where H is a number now called the Hubble constant. This relation is called the Hubble Law and the Hubble constant is the slope of the line. The line goes through the origin (0,0) because that represents our home position (zero distance) and we are not moving away from ourselves (zero speed). Hubble and Humason’s work provided convincing observational confirmation of the expansion of the universe discussed further in the next chapter.

More distant galaxy has greater redshift.
If the distance is measured in units of megaparsecs (Mpc) and the recession speed is in kilometers/second (km/sec), the Hubble constant (slope of the line) is between 70 and 80 km/sec/Mpc. This value is found by using the galaxies that have accurate distances measured (Cepheids, etc.) and dividing their recession speeds by their distances. It is easy to find the recession speeds of galaxies from their redshifts. The Hubble law provides an easy way to measure the distances to even the farthest galaxies from the (recession speed/H). For example, if a galaxy has a redshift of 20,000 km/sec and H is set to 70 km/sec/Mpc, then the galaxy’s distance = (20,000 km/sec)/(70 km/sec/Mpc) = 20,000/70 × [(km/sec)/(km/sec)] Mpc = 286 megaparsecs.
At first glance it looks like the Milky Way is at the center of the universe and it committed some galactic social blunder because all of the other galaxies are rushing away from it (there are a few true galactic friends like the Andromeda Galaxy that are approaching it). The Hubble Law shows that there is actually not a violation of the Copernican principle. Because the more distant galaxies move faster, this means that the galaxies (or galaxy clusters) are all moving away from each other—the universe is expanding uniformly. Every other galaxy or galaxy cluster is moving away from everyone else. Every galaxy would see the same Hubble Law.
In the next chapter you will see that the expansion of the universe is the expansion of space itself—the galaxies are not moving through space, but, rather, they are being carried along with the expansion of space. For now, use the figure above to see how a uniform expansion gives us the Hubble Law. Since space itself expands, all distances will increase by the same factor in the same amount of time. Galaxy (a) is 10 megaparsecs from galaxy (b) and galaxy (c) is 10 megaparsecs from galaxy (b). If the Hubble constant this time is 77 km/sec/Mpc, then galaxy (a) sees galaxy (b) moving at 770 kilometers/second away from it and galaxy (c) is moving away from galaxy (b) at 770 kilometers/second. Astronomers on galaxy (a) will see the galaxy (c) moving away at (770 + 770) kilometers/second = 1,540 kilometers/second, twice as fast as galaxy (b), because galaxy (c) is at a distance of (10 + 10) megaparsecs from galaxy (a), twice as far as galaxy (b).
The galaxy (a) astronomers see the other galaxies moving away from them and their home galaxy appears to be at rest. Now jump to galaxy (c). To the astronomers on galaxy (c), galaxy (a) is moving away at 1,540 kilometers/second and galaxy (b) is moving away at 770 kilometers/second. Their home galaxy (c) appears to be at rest. You can use similar reasoning to show that everybody will also get the same numerical value for the Hubble constant. The figure above also illustrates another point about the expansion. Notice that the sizes of the dots and the size of the threesome group at center-top do not change. The galaxies themselves do not expand and the galaxies inside a cluster do not expand away from each other. On small size scales, the internal gravity of a galaxy or galaxy cluster prevents the expansion inside the galaxy or galaxy cluster. The Hubble Law applies for only the very large distances.
Another example of how everyone will see the same Hubble Law is given in the figure below. Each of the galaxies in the figure is 100 million parsecs (about 300 million light years) apart from each other and the Hubble constant is set to 75 km/sec/Mpc here. If you choose galaxy C to be your home galaxy, then you will see galaxies B and D moving at 7,500 kilometers/second away from you because they are at a distance of 100 megaparsecs from you. Galaxies A and E are 100 megaparsecs from their closest neighbors, so they are moving away from them at 7,500 kilometers/second and 15,000 kilometers/second away from galaxy C since they are each 200 megaparsecs from galaxy C. What would the galaxy speeds be if you chose galaxy D or galaxy E as your home galaxy?

15.2.5 Masses of Galaxies
The masses of galaxies are found from the orbital motion of their stars. Stars in a more massive galaxy will orbit faster than those in a lower mass galaxy because the greater gravity force of the massive galaxy will cause larger accelerations of its stars. By measuring the star speeds, you find out how much gravity there is in the galaxy. Since gravity depends on mass and distance, knowing the size of the star orbits enables you to derive the galaxy’s mass.
For spiral galaxies the rotation curve is used to measure their masses like is done to find the mass of the Milky Way. The rotation curve shows how orbital speeds in a galaxy depend on their distance from the galaxy’s center. The mass inside a given distance from the center = (orbital speed)2 × (distance from the center)/G. The orbital speed is found from the Doppler shifts of the 21-cm line radiation from the atomic hydrogen gas. The angular distance of the piece of the disk from the center is measured, but to use the enclosed mass formula, the piece of the disk’s actual linear distance from the center must be found.
Remember way back in the planetary science chapter that the linear distance can be found from the angular distance if you know the distance to the object? The linear distance from the galaxy center = [(2π × (distance to the galaxy) × (angular distance in degrees)] / 360°. This is why you must first know the distance to a galaxy if you want to measure its mass.
For elliptical galaxies the width of the absorption lines from all of the stars blended together is used to measure the mass of elliptical galaxies. The width of the absorption lines depends on the spread of the distribution of the velocities—the velocity dispersion. The elliptical galaxy’s mass = k × (velocity dispersion)2 × (the distance the stars are from the galaxy center)/G, where k is a factor that depends on the shape of the galaxy and the angle the galaxy is from Earth.
The stars and gas in most galaxies move much quicker than expected from the luminosity of the galaxies. In spiral galaxies, the rotation curve remains at about the same value at great distances from the center (it is said to be “flat”). This means that the enclosed mass continues to increase even though the amount of visible, luminous matter falls off at large distances from the center. In elliptical galaxies, the gravity of the visible matter is not strong enough to accelerate the stars as much as they are. Something else must be adding to the gravity of the galaxies without shining.
That something else is called dark matter. It is material that does not produce detectable amounts of light but it does have a noticeable gravitational effect. Astronomers are not sure what the dark matter is made of. Possibilities range from large things like planets, brown dwarfs, white dwarfs, black holes to huge numbers of small things like neutrinos or other particles that have not been seen in our laboratories yet. The nature of dark matter is one of the central problems in astronomy today.
15.2.6 Clusters of Galaxies
Galaxies love to cluster together! Their mutual gravity can draw galaxies together into a cluster that is several millions of light years across. Some clusters have only a handful of galaxies and are called poor clusters. Other clusters with hundreds to thousands of galaxies are called rich clusters. The low mass of a poor cluster prevents the cluster from holding onto its members tightly. The poor cluster tends to be a bit more irregular in shape than a rich cluster.
Our Milky Way is part of a poor cluster called the Local Group (an imaginative name, yes?). The Local Group has two large spirals, one small spiral, two ellipticals, at least 19 irregulars, at least 17 dwarf ellipticals and at least 5 dwarf spheroidals. There may be more irregular and dwarf galaxies. The distribution of the galaxies is shown in the figure below. The Local Group is about 3 million light years across with the two large spirals, the Milky Way and Andromeda Galaxy, dominating the two ends. Each large spiral has several smaller galaxies orbiting them. The proportions of the different types of galaxies in the Local Group probably represents the number of the different types of galaxies in the rest of the universe. The small galaxies can be seen in the Local Group because they are close enough to us. But the dwarf galaxies are hard to see in far away clusters.

The closest large cluster to us is the moderately-rich cluster called the Virgo Cluster because it is in the direction of the Virgo constellation. It has many hundreds of galaxies (mostly spirals and irregulars) distributed into an irregular shape about 10 million light years across. It is about 49 to 59 million light years from us. Some ellipticals are present in the central part of the cluster including a giant elliptical at the center (M87) that has become so large by gobbling up nearby galaxies that were attracted by its enormous gravity. The total mass of the Virgo cluster is large enough that its gravity pulls nearby groups of galaxies (including the Local Group) toward it. See the zoomable map of the Local Group and the Virgo Cluster in our supercluster at National Geographic.

The center of the Virgo cluster has three giant ellipticals, M87 (bottom left corner) and M84, M86 (center right). M86 may be a lenticular S0 type instead. Courtesy of AAO
A rich cluster is seen in the Coma constellation—the Coma Cluster. It has thousands of galaxies (mostly ellipticals and S0 spirals) in a large, spherically-shaped cluster about 300 million light years from us. It is at least ten million light years across. The elliptical galaxies congregate toward the central regions while the few spirals are found on the outskirts. Two giant ellipticals (NGC 4874 & NGC 4889) occupy the central part of the cluster. Like M87 in the Virgo Cluster, they have grown very large from pulling in galaxies that were unfortunate to have strayed too close to escape the giant ellipticals’ gravity. Other rich clusters show the same segregation of the spirals from the ellipticals as the Coma Cluster. Ellipticals gather together in the center of clusters while spirals prefer to stay close to the periphery.
 The Coma cluster is a rich galaxy cluster with thousands of galaxies. Courtesy of NOAO/AURA/NSF |
 The Hercules cluster is a poor cluster with less than a hundred galaxies. Courtesy of NOAO/AURA/NSF |
15.2.7 Superclusters
The clustering phenomenon does not stop with galaxies. Galaxy clusters attract each other to produce superclusters of tens to hundreds of clusters. Their mutual gravity binds them together into long filaments (thin, string-like structures) 300 to 900 million light years long, 150 to 300 million light years wide, and 15 to 30 million light years thick on average. The discovery of these huge structures was made recently from years of taking Doppler shifts of thousands of galaxies. The Doppler shifts of the galaxies were converted to distances using the Hubble Law. Between the filamentary superclusters are HUGE voids with very few (if any) galaxies. The voids are typically 150 million light years across.
Two pioneers in the mapping of the structure of the universe are Margaret Geller and John Huchra. They and their students took thousands of spectra of galaxies along thin pie-shaped slices of the sky over 15 years to produce the map with 2 slices extending out about 400 million light years shown below. It would take much too long to take spectra of galaxies in every direction in space, so astronomers map the universe in slices.
Courtesy of Geller, da Costa, Huchra and Falco.
In 2003, the Anglo-Australian Observatory released a much larger survey (“2dF Galaxy Redshift Survey“) of over 221,000 galaxies in two slices that extend over 1.5 billion light years in a two-degree field of the sky. The 2dF survey system could take the spectra of 400 objects simultaneously so it took them “only” 5 years to complete the survey. It is shown in the figure below. Each blue dot is a galaxy. The arrangement of the superclusters and voids looks like a bunch of soap bubbles or Swiss cheese with the galaxies on the borders of the huge holes. Although the picture below is only a two-dimensional version of the three-dimensional map, you can still see the lacy, foamy structure. In 2009, AAO completed a six-degree field galaxy survey called 6dF Galaxy Survey that did not go quite as deep but gave greater detail of the local structure. Go to the 6DFGS Gallery for their pie slice maps.
The Sloan Digital Sky Survey (SDSS) greatly expanded the volume to a million galaxies in one-quarter of the entire sky. SDSS measured spectra of more than 930,000 galaxies and 120,000 quasars as well as mapping the structure of the Milky Way by taking spectra of 240,000 stars and finding Type Ia supernovae to help us measure the history of the expansion of the universe. One of the pie slices is shown below. Other slices are available on Lauren Grodnick’s large scale structure page. The current SDSS-III project is focusing on three areas: dark energy and cosmological parameters; the structure, dynamics, and chemical evolution of the Milky Way; and the architecture of planetary systems. The third phase will be finished in 2014.

What produces the long thin strands of clusters around the huge bubbles of empty space? Obviously, gravity is the force at work, but how has it worked to produce these structures? Dark matter must play a significant role but how it does that is not completely known. Astronomers are using powerful supercomputers to simulate the gravitational interactions of millions of particles and they program guesses of the behavior of dark matter into the simulation code. Early results from the simulations are able to produce the filamentary structure and voids.
The picture below shows a supercomputer simulation of a 300 million light year cube of the universe using 47 million particles interacting with each other through the force of gravity. The galaxies clump together into clusters and the galaxy clusters gather together into huge string-like superclusters with big gaps (voids) in between. The colors represent differences in density: from lowest to highest density the colors are black, blue, pink, red, orange, yellow, and white (highest density peaks). The image is a much compressed jpeg version of a gif image from the HPCC group at the University of Washington. Some details have been lost in the compression, but you can select the image to bring up the original uncompressed gif file in another window.

Another nice set of pictures and movies of the formation of the large-scale structure can be found at:
- Center for Cosmological Physics at the University of Chicago from which the sequence of pictures below came. “Z” in the picture corresponds to the redshift of the Hubble Law. Remember that greater redshifts are at greater distances and greater “look back” times—we see the universe as it was.

- The Virgo Consortium an international group using supercomputers to simulate the formation of galaxies, galaxy clusters, large-scale structure, and the intergalactic medium.
15.2.8 Galaxy Origins
All galaxies began forming at about the same time approximately 13 billion years ago. The origin of galaxies and how they changed over billions of years is an active field of research in astronomy today. Models for galaxy formation have been of two basic types: “top-down” and “bottom-up.” The “top-down” model on the origin of the galaxies says that they formed from huge gas clouds larger than the resulting galaxy. The clouds began collapsing because their internal gravity was strong enough to overcome the pressure in the cloud. If the gas cloud was slowly rotating, then the collapsing gas cloud formed most of its stars before the cloud could flatten into a disk. The result was an elliptical galaxy. If the gas cloud was rotating faster, then the collapsing gas cloud formed a disk before most of the stars were made. The result was a spiral galaxy. The rate of star formation may be the determining factor in what type of galaxy will form. But, perhaps the situation is reversed: the type of galaxy determines the rate of star formation. Which is the “cause” and which is the “effect”?
A more recent variation of the “top-down” model says that there were extremely large gas clouds that fragmented into smaller clouds. Each of the smaller clouds then formed a galaxy. This explains why galaxies are grouped in clusters and even clusters of galaxy clusters (superclusters). However, the model predicts a very long time for the collapse of the super-large clouds and fragmentation into individual galaxy clouds. There should still be galaxies forming today. One galaxy called “I Zwicky 18” was recently discovered to be a very young galaxy that began forming stars only 500 million years ago. However, it is a dwarf galaxy whose formation might better be explained by the “bottom-up” model called “hierarchical clustering.”

I Zwicky 18 is a nearby dwarf galaxy that started forming stars only 500 million to one billion years ago. It may be an example of what the galaxies were like over 12 billion years ago. How this galaxy remained in an embryonic state for almost the entire history of the universe is unknown. Is it an example of a “dark galaxy”—a dark matter clump with cold primeval hydrogen and helium gas—in which the gas only now got compressed enough to form stars? One variation of the “bottom-up” galaxy formation model says that such “dark galaxies” are very numerous but very hard to see.
The “bottom-up” model builds galaxies from the merging of smaller clumps about the size of a million solar masses (the sizes of the globular clusters). These clumps would have been able to start collapsing when the universe was still very young. Then galaxies would be drawn into clusters and clusters into superclusters by their mutual gravity. This model predicts that there should be many more small galaxies than large galaxies—that is observed to be true. The dwarf irregular galaxies may be from cloud fragments that did not get incorporated into larger galaxies. Also, the galaxy clusters and superclusters should still be in the process of forming—observations suggest this to be true, as well.

The radio galaxy MRC 1138-262, also called the “Spiderweb Galaxy” is a large galaxy in the making. At 10.6 billion light years away, we see it in the process of forming only 3 billion years after the Big Bang. Note the small, thin “tadpole” and “chain” galaxies that are merging together to create a giant galaxy.
Astronomers are now exploring formation models that combine the “top-down” and “bottom-up” models. These models also are incorporating the dark matter that is now known to make up most of the mass of the universe. Huge dark matter clumps the size of superclusters gather together under the action of gravity into a network of filaments. Where the dark matter filaments intersect, regular matter concentrates into galaxies and galaxy clusters. The densest places would have had more rapid star formation to make the elliptical galaxies while the lower density concentrations would have made the spiral galaxies and dwarf galaxies. In such a model, the visible galaxies ablaze in starlight are like the tip of an iceberg—the visible matter is at the very densest part of much larger dark matter chunks. Some dark matter clumps may have cold hydrogen and helium gas making “dark galaxies” that have not become concentrated enough to start star formation—I Zwicky 18 may be an example of one that did just recently.
A dark matter map was published at the beginning of 2007 that probed the dark matter distribution over a large expanse of sky and depth (distance—see the “Dark matter map” figure below). The map is large enough and has high enough resolution to show the dark matter becoming more concentrated with time. The map stretches halfway back to the beginning of the universe. It also shows the visible matter clumping at the densest areas of the dark matter filaments (see the “Distribution of Visible and Dark Matter” figure below). The dark matter distribution was measured by the weak gravitational lensing of the light from visible galaxies by the dark matter (see the relativity chapter).


15.2.8.1 Galaxy Collisions and Mergers
Modern research into galaxy formation is also exploring the role that mergers and collisions of galaxies plays in the structure of galaxies. The distances between galaxies is large, but compared to the size of the galaxies, the distances are not extremely large. Stars inside a galaxy do not collide because the distances between them are hundreds of thousands to millions of times larger than the sizes of the stars. The distances between galaxies are only a few tens of times bigger than the galaxy sizes. Our Milky Way has several small galaxies orbiting it that are one to two Milky Way diameters away. The closest large galaxy, the Andromeda Galaxy, is only about 30 Milky Way diameters away. Galaxies in rich clusters are closer to each other than that.
Collisions take place over very long timescales compared to the length of our lifetime—several tens of millions of years. In order to study the collisions, astronomers use powerful computers to simulate the gravitational interactions between galaxies. The computer can run through a simulation in several hours to a few days depending on the computer hardware and the number of interacting points. The results are checked with observations of galaxies in different stages of interaction. Note that this is the same process used to study the development of stars. The physics of stellar interiors are input into the computer model and the entire star’s life cycle is simulated in a short time. Then the results are checked with observations of stars in different stages of their life.
In the past, computer simulations used several million points to represent a galaxy to save on computer processing time. A simulation of several million points could take many weeks to process. However, galaxies are made of billions to trillions of stars, so each point in the simulation actually represented large clusters of stars. The simulations were said to be of “low resolution” because many individual stars were smeared together to make one mass point in the simulation. The resolution of a computer simulation does affect the result, but it is not known how much of the result is influenced by the resolution of the simulation and how much the ignorance of the physics plays a role. Computer hardware speeds and the programming techniques have greatly improved, so astronomers are now getting to the point where they can run simulations with several billion mass points in a few weeks time.
When two galaxies collide the stars will pass right on by each other without colliding. The distances between stars is so large compared to the sizes of the stars that star-star collisions are very rare when the galaxies collide. The orbits of the stars can be radically changed, though. Gravity is a long-range force and is the primary agent of the radical changes in a galaxy’s structure when another galaxy comes close to it. Computer simulations show that a small galaxy passing close to a disk galaxy can trigger the formation of spiral arms in the disk galaxy. Alas! The simulations show that the arms do not last long. Part of the reason may be in the low resolution of the simulations.
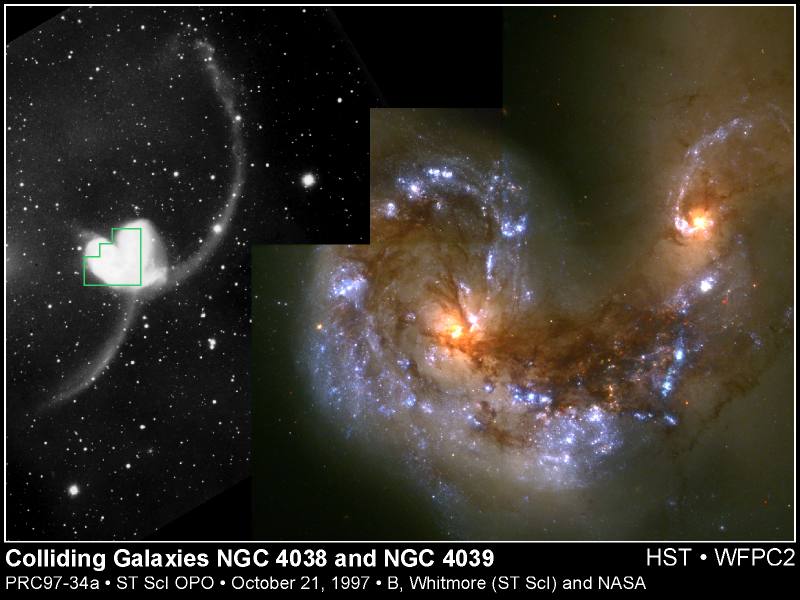
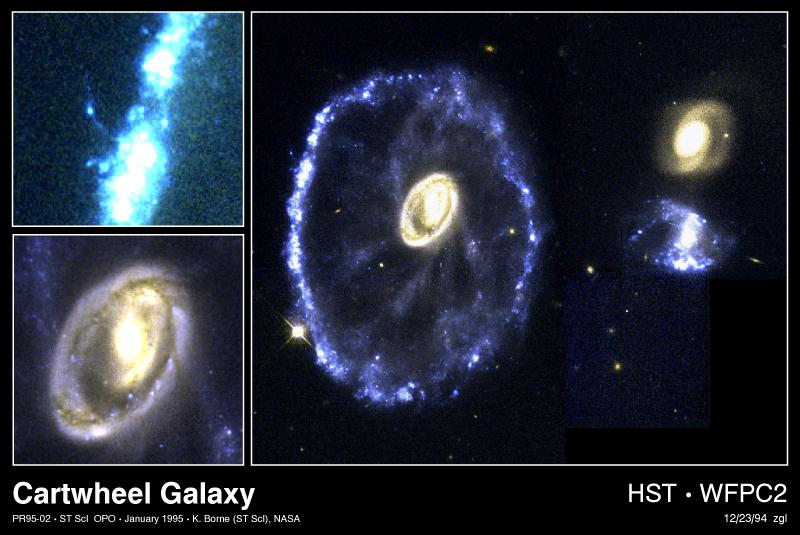
The stars may be flung out from the colliding galaxies to form long arcs. Several examples of very distorted galaxies are seen with long antenna-like arcs. In some collisions a small galaxy will collide head-on with a large galaxy and punch a hole in the large galaxy. The stars are not destroyed. The star orbits in the large galaxy are shifted to produce a ring around a compact core.

Select the “Antennae Galaxies formation movie” link below to show a movie of a computer simulation from Joshua Barnes showing the formation of the Antennae Galaxies. It is a Quicktime movie, so you will need a Quicktime viewer. The red particles are the dark matter particles and the white and green are stars and gas, respectively. Other collision movies are available on Barnes’ Galaxy Transformations web site and on Chris Mihos’ Galaxy Collisions and Mergers website.
Antennae Galaxies formation movie (will display in another window).Here are some photographs of examples of these collisions. The first is the Antennae Galaxies (NGC 4038 & NGC 4039) as viewed from the ground (left) and from the Hubble Space Telescope (right). Note the large number of H II regions produced from the collision. The second is the Cartwheel Galaxy as seen by the Hubble Space Telescope. A large spiral was hit face-on by one of the two galaxies to the right of the ring. The insets on the left show details of the clumpy ring structure and the core of the Cartwheel. Selecting the images will bring up an enlarged version in another window. See Mihos’ galaxy modelling website for simulations of the creation of the Cartwheel Galaxy.
The gas clouds in galaxies are much larger than the stars, so they will very likely hit the clouds in another galaxy when the galaxies collide. When the clouds hit each other, they compress and collapse to form a lot of stars in a short time. Galaxies undergoing such a burst of star formation are called starburst galaxies and they can be the among the most luminous of galaxies.
Messier 82 (a starburst in the M81 group)
Though typical galaxy collisions take place over what to us seems a long timescale, they are short compared to the lifetimes of galaxies. Some collisions are gentler and longer-lasting. In such collisions the galaxies can merge. Computer simulations show us that the big elliptical galaxies can form from the collisions of galaxies, including spiral galaxies. Elliptical galaxies formed in this way have faint shells of stars or dense clumps of stars that are probably debris left from the merging process. Mergers of galaxies to form ellipticals is probably why ellipticals are common in the central parts of rich clusters. The spirals in the outer regions of the clusters have not undergone any major interactions yet and so retain their original shape. Large spirals can merge with small galaxies and retain a spiral structure.
Some satellite galaxies of the Milky Way are in the process of merging with our galaxy. The dwarf elliptical galaxy SagDEG in the direction of the Milky Way’s center is stretched and distorted from the tidal effects of the Milky Way’s strong gravity. The Canis Major Dwarf galaxy about 25,000 light years from us is in a more advanced stage of “digestion” by the Milky Way—just the nucleus of a former galaxy is all that is left. A narrow band of neutral hydrogen from other satellite galaxies, the Magellanic Clouds, appears to be trailing behind those galaxies as they orbit the Milky Way. The band of hydrogen gas, called the “Magellanic Stream”, extends almost 90 degrees across the sky away from the Magellanic Clouds and may be the result of an encounter they experienced with the Milky Way about 200 million years ago. At least eight other streams in the Milky Way from other dwarf galaxies have been found.
The giant ellipticals (called “cD galaxies”) found close to the centers of galaxies were formed from the collision and merging of galaxies. When the giant elliptical gets large enough, it can gobble up nearby galaxies whole. This is called galactic cannibalism. The cD galaxies will have several bright concentrations in them instead of just one at the center. The other bright points are the cores of other galaxies that have been gobbled up.

Messier 87 (a cD galaxy that has grown large by swallowing smaller galaxies)
If collisions and mergers do happen, then more interactions should be seen when looking at regions of space at very great distances. When you look out to great distances, you see the universe as it was long ago because the light from those places takes such a long time to reach us over the billions of light years of intervening space. Edwin Hubble’s discovery of the expansion of the universe means that the galaxies were once much closer together, so collisions should have been more common.
Pictures from the Hubble Space Telescope of very distant galaxies show more distorted shapes, bent spiral arms, and irregular fragments than in nearby galaxies (seen in a more recent stage of their development).

The Hubble Ultra Deep Field—a narrow look back through time past many intervening galaxies to the universe as it looked billions of years ago near the start of the expansion. There were more distorted (interacting) galaxies back then! The larger fuzzy patches in the picture are closer galaxies and the smallest bright points are very distant galaxies. It is a 278-hour exposure (over 412 orbits) of a single piece of sky in the Fornax constellation. In early 2010, astronomers announced that they were able to detect galaxies from the time of just 600 million to 800 million years after the birth of the universe (the Big Bang) using the new camera on the Hubble Space Telescope.
The formation of galaxies is one major field of current research in astronomy. Astronomers are close to solving the engineering problem of computer hardware speeds and simulation techniques so that they can focus on the physical principles of galaxy formation. One major roadblock in their progress is the lack of understanding of the role that dark matter plays in the formation and interaction of galaxies. Since the dark matter’s composition and how far out it extends in the galaxies and galaxy clusters is is only beginning to be mapped (and see also link), it is not known how to best incorporate it into the computer simulations. Faced with such ignorance of the nature of dark matter, astronomers try inputting different models of the dark matter into the simulations and see if the results match the observations. The recent discovery of “dark energy” is another major unknown in galaxy evolution models though its effects may be more important to the future of the universe than to origin and early history of the galaxies in which gravity and gas dynamics played the significant role.
There will be many new fundamental discoveries made in the coming years, so this section of the web site will surely undergo major revisions of the content. Although the content of our knowledge will be changed and expanded, the process of figuring out how things work will be the same. Theories and models will be created from the past observations and the fundamental physical laws and principles. Predictions will be made and then tested against new observations. Nature will veto our ideas or say that we are on the right track. Theories will be dropped, modified, or broadened. Having to reject a favorite theory can be frustrating but the excitement of meeting the challenge of the mystery and occasionally making a breakthrough in our understanding motivates astronomers and other scientists to keep exploring.
Sections Review
Vocabulary
- dark matter
- galactic cannibalism
- Hubble Law
- poor cluster
- rich cluster
- rotation curve
- starburst galaxy
- supercluster
- velocity dispersion
Review Questions 2
- Why must the distance to a galaxy be known first before you can measure such basic properties of the galaxy such as its luminosity, mass, and size?
- What are the various ways you can find distances to the galaxies?
- What do you find when you plot the redshifts of the galaxies vs. their distance from us? How does the speed of most galaxies vary with increasing distance from our galaxy?
- How does the Hubble Law show that the universe is expanding?
- How does the Hubble Law show that all of the galaxies are moving away from each other and that astronomers in every galaxy will see the same Hubble law?
- How can you measure the masses of galaxies?
- What is it about the motions of the stars in galaxies that indicates a large amount of dark matter is present?
- What is a cluster of galaxies? Are we in one? What is the nearest large cluster of galaxies to us?
- How are spiral galaxies formed?
- Why are collisions of galaxies much more common than collisions of stars? (Revisit the activities, A Sense of Scale, Parts I & II, from Chapter 1 for a visual aid.)
- What two ways are there to create an elliptical galaxy?
- What kind of galaxy is typically found near the center of a large cluster of galaxies? Why is that kind of galaxy so big?
- Why is the spatial distribution of clusters of galaxies sometimes described as a foamy structure or like edges of soap bubbles? How do we know that the clusters have this spatial distribution?
15.3 Active Galaxies
When the universe was younger, some galaxies produced a lot more radiation than galaxies do today. A typical galaxy shines with the energy from billions of stars and is tens of thousands of light years (or more) across. A peculiar group of galaxies are extremely luminous but very compact. The light from these active galaxies is produced by a strange process in the centers of the galaxies. Sometimes starburst galaxies are grouped with these peculiar galaxies, but here I will consider an “active galaxy” to be a galaxy with a very luminous nucleus. The great luminosity of starburst galaxies is not confined to their nucleus.
15.3.1 Quasars
The two basic things used for studying the far away galaxies are (1) the data encoded in the light received; and (2) our creative minds to interpret what is seen using the laws of physics. Some blue star-like objects appeared to violate those rules. Stars do not produce much energy in the radio band, so when strong radio emission coming from some blue stars was spotted in 1960, astronomers quickly took spectra of the stars in the visible (optical) band to find out the conditions in these strange objects. However, the pattern of lines did not match any of the lines seen in thousands of stellar spectra gathered over a hundred years. Furthermore, the spectra of the blue radio sources did not have absorption lines, but broad emission lines! What a mystery!

Which is the quasar and which is an ordinary star? (The quasar is the bright one on the left.) Courtesy of Space Telescope Science Institute.

Maarten Schmidt solved the mystery in 1963. In order to figure out the structure of the atoms producing the bizarre spectra, he set out to construct an energy level diagram from the pattern of the emission lines. He made some mistakes in his calculations because his calculations were not showing the regularity he could clearly see in the spectrum of a radio source called 3C 273 (the 273rd object in the third Cambridge catalog of radio sources). As a test of the regularity he compared the spectrum of 3C 273 with the spectrum of hydrogen. He was shocked because the pattern was the same but greatly redshifted! 3C 273 is moving at a speed of 47,400 kilometers/second (almost 16% the speed of light!). The Hubble Law says that this blue radio object is far outside the Galaxy. The other radio “stars” were also at great distances from us. They are called quasi-stellar radio sources or quasars for short. Later, some other blue star-like objects at large redshifts were discovered to have no radio emission, but they are also called quasars.
What is strange about the quasars is not their great distance, but, rather, their incredible luminosities. They are hundreds to thousands of times more luminous than ordinary galaxies. Yet, all of this energy is being produced in a small volume of space. Their luminosity varies on time scales of a few months to as short as a few days. Remember from the discussion of pulsars and black holes in the stellar development chapter that the light fluctuation time scale from any object gives you an estimate of the maximum possible size of the object. The maximum size = (speed of light) × (light fluctuation time interval). The quasars that vary their light output over a few months are about the size of our solar system. This is tens of thousands of times smaller than a typical galaxy!

The shape of the continuous part of a quasar spectrum is also quite unusual. Stars are luminous in primarily the visible (optical) band of the electromagnetic spectrum. The hottest stars also emit a significant fraction of their light in the ultraviolet band and the coolest stars emit a significant fraction of their light in the infrared band. Regardless of the star, though, the spectrum of a star, and, hence, the spectrum of a normal galaxy, rises to a peak at some wavelength determined by the temperature (remember Wien’s law?) and drops off at wavelengths shorter or longer than the peak wavelength. Such a spectrum is called a thermal spectrum because it depends on just the temperature.

Quasars have a decidedly non-thermal spectrum: they are luminous in the X-rays, ultraviolet, visible, infrared, and radio bands. They have about the same power at all of the wavelengths down to the microwave wavelengths (shortwave radio wavelengths). The spectrum looks like the synchrotron radiation from charged particles spiraling around magnetic field lines at nearly the speed of light (remember the emission from pulsars?).
Perhaps the quasars are not as far away as the Hubble Law says from their redshifts. If their large redshifts are due to some powerful explosive event that shot the quasars out at some tremendous speed, then you would not have to worry about the tremendous luminosities. That would be nice, but unfortunately (or fortunately, if you like a good mystery) that does not appear to be the case. Quasars are found in clusters of galaxies. The galaxies are much fainter than the quasars so only the largest telescopes can gather enough light to create a spectrum for those far away galaxies. Their spectra also have the same large redshift of the quasars in the cluster. Also, some quasars are close enough to us that some fuzz is seen around them. The color of the fuzz is like that of normal galaxies. The spectra of the fuzzy patches around the bright quasar shows that the light from the fuzz is from stars.
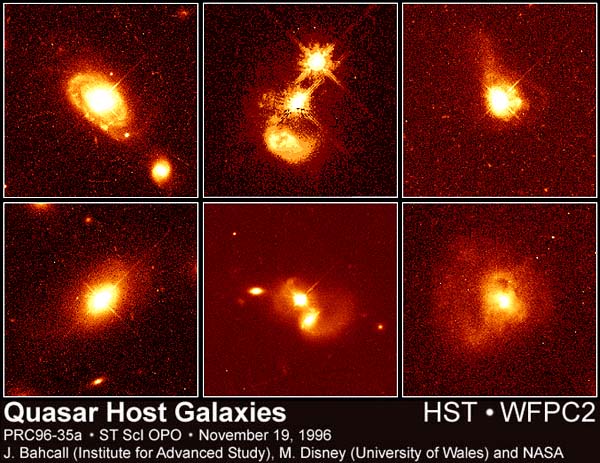
Equal opportunity quasar hosts: top left: core of normal spiral, bottom left: core of normal elliptical, top center: spiral galaxy hit face-on to make a quasar+starburst galaxy, bottom center: quasar merging with a bright galaxy and maybe another one, top right: tail of dust and gas show that the host galaxy collided with another one, bottom right: merging galaxies create a quasar in their combined nucleus. Select the image to view an enlarged version in another window. Courtesy of Space Telescope Science Institute.
In addition, the gravitational lensing of quasars by distant galaxies is only possible if the lensed quasars are farther away than the galaxy bending the quasar’s light. Quasars are the exceptionally bright nuclei of galaxies!
15.3.2 Active Galaxies
Not all active galaxies blaze with the strength of a quasar. They do exhibit a non-thermal spectrum that has no peak and does not depend on the temperature. Also, their energy is generated in the nuclei of galaxies. The active galaxies are less energetic cousins of the quasars. Their luminosity is between the luminosities of typical galaxies and the powerful quasars. Whatever is going on in quasars, is going on in active galaxies to a lesser extent.
One type of active galaxy is the Seyfert galaxy, named after Carl Seyfert who was the first to discover the peculiar spectra of these types of galaxies. A Seyfert galaxy is a spiral galaxy with a compact, very bright nucleus that produces a non-thermal continuous spectrum with broad (fat) emission lines on top. Some of the emission lines are produced by atoms that have several electrons removed from them. Such highly ionized atoms are found only in regions of intense energy. Many Seyfert nuclei are in disks with distorted spiral arms and a companion galaxy nearby that is probably gravitationally interacting with the galaxy.

The Seyfert galaxy NGC 1566.
The energy of Seyfert galaxy nuclei fluctuates quickly like the quasar fluctuations, so the energy generator must be quite small. The broad emission lines are produced by gas clouds moving at about 10,000 kilometers/second. The Doppler shifts of the gas moving around the core widens the emission lines. Some Seyfert galaxies have narrow emission lines instead of broad emission lines and are bright at infrared wavelengths. These are called “Type 2” Seyferts to distinguish them from the classical “Type 1” Seyferts with the broad emission lines.
Another type of active galaxy is the radio galaxy, which emits huge amounts of radio energy. The radio emission comes from the core AND from very large regions on either side of the optical part of the galaxy called “radio lobes.” The radio lobes can extend for millions of light years from the center of the galaxy. The radio emission from normal galaxies is thousands to millions of times less intense and is from the gas between the stars. Most radio galaxies are elliptical galaxies. The spectrum of the radio emission has the same non-thermal (synchrotron) shape as the quasars and Seyferts. The radio lobes are produced from electrons shot out from the nucleus in narrow beams called jets. When the electrons in the beam hit the gas surrounding the galaxy, the beam spreads out to form the lobes.
 |
 Quasars can have huge radio lobes too. Quasars can have huge radio lobes too. |
Some lobes are swept out into arcs behind the galaxy. This is probably caused by the galaxy moving through the gas around the galaxy. A third type of active galaxy called BL Lacertae objects (BL Lac objects for short) are probably radio galaxies with their jets pointed right at us. The energy from BL Lac objects varies very quickly and erratically.
15.3.3 Power Source for Active Galaxies and Quasars
So here’s the problem: how does nature produce such objects that are luminous over a large range of wavelengths and generate the energy in a very small volume? The number of stars needed to produce the tremendous luminosity could not be packed into the small region and neither would they produce the peculiar non-thermal radiation. One mechanism you have already learned about is the intense radiation produced by hot gas in an accretion disk around a black hole.
In order to produce the enormous amount of energy seen in active galaxies and quasars, the black hole must be supermassive. The intense radiation from the disk would drive the gas outward if the black hole did not have enough gravity to keep the gas falling onto the black hole. In order to keep the gas spiraling in and heating up, the mass of the black hole must be hundreds of millions to several billion solar masses. The accretion disk is a few trillion kilometers across (a few light months across) but most of the intense radiation is produced within a couple of hundred billion kilometers from the black hole.

The gas in the disk is heated by the friction it experiences rubbing against other gas in the disk and also by the release of gravitational potential energy as it falls inward onto the black hole. If you have dropped down from a large height (from a tree or ladder?) you know that your feet absorb a lot more energy than if you dropped from a small height (you did land on your feet, hopefully). The gravitational potential energy you had above the ground was converted to kinetic energy (energy of motion) as you fell. If you dropped to the ground from a very high height (great gravitational potential energy), you know that you would hit the ground with a great amount of energy. The situation would be worse on an object with stronger gravity. The process of converting mass to energy from falling onto a black hole has an efficiency that is over ten times as large as the efficiency of nuclear fusion. The amount of mass needed to power the nuclei in active galaxies is from one to ten solar masses per year.
If there is a strong magnetic field in the accretion disk, the magnetic field lines can be distorted into a tangled, narrow mess of magnetic field lines that run toward the poles perpendicular to the accretion disk. Gas escaping along the magnetic field would produce the beams of electrons and gas seen in the jets to make the radio lobes of radio galaxies. Also, the shape of the accretion disk may play a role in directing the gas into the jets. The outer parts of the disk can be thick, but they will narrow down to a very thin layer just outside of the black hole. A thick accretion disk that narrows down only very close to the black hole could pinch the outflowing gas into a narrow beam.
Around the accretion disk are relatively dense clouds of hot gas that could be responsible for the broad emission lines seen in Type 1 Seyferts. Further out is a thick dusty molecular doughnut-shaped ring with a diameter of ten to several hundred light years. The particular type of active galaxy seen then simply depends on the angle the accretion disk and dust ring are to the line of sight.
If the accretion disk is tipped enough, the fast-moving hot clouds that produce the broad emission lines of Type 1 Seyferts are visible. If the dust ring hides the accretion disk, then only the slower-moving hot clouds that are farther from the black hole are visible. The results is the narrow emission lines and the dust ring glowing in the infrared of a Type 2 Seyfert. If the disk is face-on and a beam of radiation is being produced, then the active galaxy is a BL Lac object.
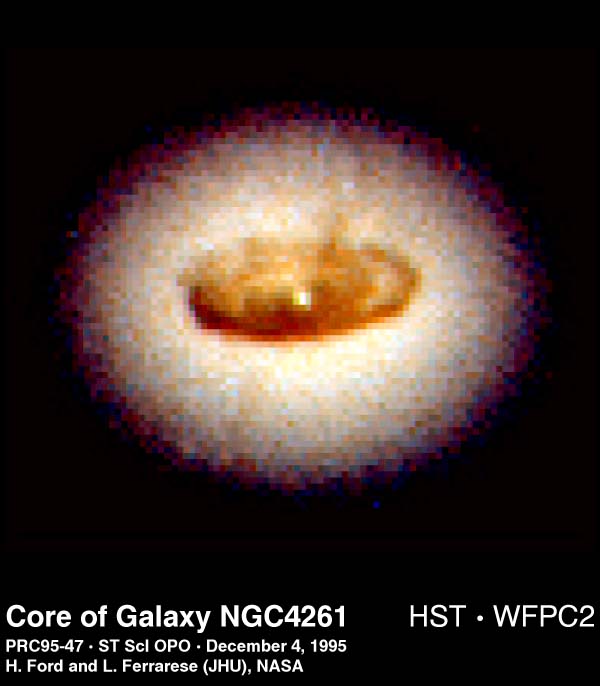
The Hubble Space Telescope has imaged the nuclei of several active galaxies. Around the core of the radio galaxy NGC 4261 is a ring of dust and gas about 400 light years in diameter and the jets emerge perpendicular to the plane of the dust/gas ring. The black event horizon of the supermassive black hole is too small to be resolved from our distance. Select the image to view an enlargement of the HST image in another window.
The core of the active galaxy M87 is seen to have a disk of hot gas moving very quickly around the center. Doppler shifts of the disk material close to the center show that the gas is moving at speeds of hundreds of kilometers per second. Blueshifted lines are produced from one part of the disk and redshifted lines are produced from the opposite part of the disk. This is clear proof that the disk is rotating. The speed and distance the gas is from the center show that the central object must have a mass of 2.5 billion solar masses. Only a black hole could be this massive and compact. The jet coming from the nucleus (visible in the wider-field view at right) is also seen to be perpendicular to the plane of the disk.

15.3.4 The Short Life of an Active Galaxy
Galaxy nuclei do not remain active for billions of years. Eventually, the gas fuel runs out in the accretion disk. The disk’s gas can be replenished if some stars in the galaxy wander too close to the central black hole and get stretched apart by the black hole’s strong gravity.
Select the link below to show a spiral galaxy turning into a quasar when some material is dumped onto the supermassive black hole at the center. It is a mpeg movie, so you will need to have a mpeg viewer.
Quasar movie from the Space Telescope Science Institute
Also, galaxy mergers and collisions will keep the gas and stars in the central part of active galaxies sufficiently stirred up so some of that material will become part of the accretion disk. The expansion of the universe decreases the rate at which interactions will happen. Because the frequency of galaxy close encounters decreases over time as the universe expands, the quasars and active galaxies can last for only a few billion years at most.

Quasars tend to be found at great distances from us; there are no nearby quasars. When we look at quasars, we see them as they were billions of years ago. The number of them increases at greater distances, so that must mean they were more common long ago. The number of quasars peaks at a time when the universe was about 20% of its current age. Back then the galaxies were closer together and collisions were more common than today. Also, the galaxies had more gas that had not been incorporated into stars yet. The number of quasars was hundreds of times greater than the time closer to the present. At very great distances the number of quasars drops off. The light from the most distant quasars are from a time in the universe before most of the galaxies had formed, so fewer quasars could be created.
This model predicts that there should be many dead quasars lurking at the cores of galaxies. Astronomers are beginning to find the inactive supermassive black holes in some galaxies. In most galaxies the central black hole would have been smaller than the billions of solar mass black holes for quasars. This is why the less energetic active galaxies are more common than quasars. Our galaxy harbors a supermassive black hole in its core that has a mass of “only” 4.5 million solar masses. Astronomers are studying the cores of other normal galaxies to see if there are any signs of supermassive black holes that are now “dead”.
 The beautiful grand-design spiral, the Whirlpool Galaxy. Courtesy of NOAO/AURA/NSF The beautiful grand-design spiral, the Whirlpool Galaxy. Courtesy of NOAO/AURA/NSF |
 X marks the spot in the core of the Whirlpool Galaxy! The darkest bar may be the dust ring seen edge-on. The jet seen in wider fields of view is perpendicular to the darkest dust ring. The lighter bar may be another disk seen obliquely. A million solar mass black hole is thought to lurk at the center. Courtesy of Space Telescope Science Institute X marks the spot in the core of the Whirlpool Galaxy! The darkest bar may be the dust ring seen edge-on. The jet seen in wider fields of view is perpendicular to the darkest dust ring. The lighter bar may be another disk seen obliquely. A million solar mass black hole is thought to lurk at the center. Courtesy of Space Telescope Science Institute |
An important implication of the fact that there were more quasars billions of years ago than there are now, is that the universe changes over time. The conditions long ago were more conducive to quasar activity than they are today. In the next chapter you will explore the overall evolution of the universe. You will need to remember this point about a changing universe when you consider ideas for how the universe formed and grew. Also, the sharp drop in the quasar number for the earliest times is evidence for a beginning to the universe.
Sections Review
Vocabulary
- active galaxy
- quasar
- radio galaxy
- Seyfert galaxy
Review Questions 3
- Compare the luminosity and size of the power source for quasars to that of a normal galaxy.
- Contrast the shape of the spectrum and the relative power at different wavelength bands (X-ray, ultraviolet, visible, infrared, radio) for the energy coming from quasars (and active galaxies) to that from normal galaxies (and stars).
- What produces the huge power output in quasars and active galaxies?
- What determines the type of active galaxy (i.e., Seyfert 1 or 2, radio galaxy, BL Lac, etc.) you will see?
- What could cause the power generation to “turn off” and later turn back on?
- What is the broad-line emission region and what must the orientation of the disk and dust ring be to see the broad-line emission region?
- What are the jets in active galaxies and how are they produced?
- Why are there many more quasars billions of light years away than nearby? Include in your explanation a contrast of the conditions of the universe billions of years ago to the current conditions.
- What does the changing number of quasars with increasing distances tell us about the character of the universe?
15.4 Steps to the Hubble Constant
This section is a short essay that summarizes the ways astronomers find distances to various objects in the universe.
Why care so much about finding distances in astronomy? If you know the distance to a star, you can determine its luminosity and mass. You can then discover a correlation between luminosity, mass, and temperature for main sequence stars that our physical theories must account for. Finding distances to stellar explosions like planetary nebulae and supernovae enables you to find the power needed to make the gaseous shells visible and how much was needed to eject them at the measured speeds. Stellar distances and distances to other gaseous nebulae are necessary for determining the mass distribution of our galaxy. Astronomers have then been able to discover that most of the mass in our Galaxy is not producing light of any kind and is in a dark halo around the visible parts of the Galaxy.
Finding distances to other galaxies enables you to find their mass, luminosity, and star formation history among other things. You are better able to hone in on what is going on in some very active galactic cores and also how much dark matter is distributed among and between galaxy cluster members. From galaxy distances, you are also able to answer some cosmological questions like the large-scale geometry of space, the density of the universe needed to stop the expansion (called Ω [“Omega”]), age of the universe, and whether or not the universe will keep expanding. The cosmological questions will be discussed fully in the next chapter on cosmology. This is only a quick overview of the reasons for distance measurements and is by no means an exhaustive list of reasons why distance measurements are so important.
Now let’s take a look at the distance scale ladder. The bottom foundational rung of the ladder is the most accurate and the most certain of all the distance determination methods. Each rung depends on the rung below and it is less certain than the previous one.
15.4.1 Rung 1: The Astronomical Unit
The Earth and Distance to the Sun. Radar reflections from Venus and its angular separation from the Sun are used to calculate the numerical value of the Astronomical Unit (AU). You can use radar to measure distances out to 50 AU.
15.4.2 Rung 2: Geometric Methods
On the next rung of the distance scale ladder, you can convert trigonometric parallax measurements into distances to the nearby stars using their angular shift throughout the year and the numerical value of the Astronomical Unit. Distances to nearby clusters like the Hyades or the Pleiades are found via trigonometric parallax or the moving clusters method (another geometric method). The cluster’s main sequence is calibrated in terms of absolute magnitude (luminosity). Geometric methods are used to find distances out to about 100 parsecs (or several hundred parsecs with Hipparcos’ data).
15.4.3 Rung 3: Main Sequence Fitting and Spectroscopic Parallax
On the next rung outward the spectral type of star is determined from its spectral lines and the apparent brightness of the star is measured. The calibrated color-magnitude diagram is used to get its luminosity and then its distance from the inverse square law of light brightness.
The entire main sequence of a cluster is used in the same way to find the distance to the cluster. You first plot the cluster’s main-sequence on a color-magnitude diagram with apparent magnitudes, not absolute magnitude. You find how far the unknown main sequence needs to be shifted vertically along the magnitude axis to match the calibrated main sequence. The amount of the shift depends on the distance.
The age of the cluster affects the main sequence. An older cluster has only fainter stars left on the main sequence. Also, stars on the main sequence brighten slightly at a constant temperature as they age so they move slightly vertically on the main sequence. You must model the main sequence evolution to get back to the Zero-Age Main Sequence. This method assumes that all Zero-Age main sequence stars of a given temperature (and, hence, mass) start at the same luminosity. These methods can be used to find distances out to 50 kiloparsecs.
15.4.4 Rung 4: Period-Luminosity Relation for Variable Stars
Continuing outward you find Cepheids and/or RR-Lyrae in stars clusters with a distance known through main sequence fitting. Or you can employ the more direct “Baade-Wesselink method” that uses the observed expansion speed of the variable star along the line of sight from the Doppler shifts in conjunction with the observed angular expansion rate perpendicular to the line of sight. Since the linear expansion rate depends on the angular expansion rate and the distance of the star, the measurement of the linear expansion rate and angular expansion rate will give you the distance of the variable star.
RR-Lyrae have the same time-averaged luminosity (about 49 solar luminosities or an absolute magnitude MV = +0.6). They pulsate with periods < 1 day. Cepheids pulsate with periods > 1 day. The longer the pulsation, the more luminous they are. There are two types of Cepheids: classical (brighter, type I) and W Virginis (fainter, type II). They have different light curve shapes. The period-luminosity relation enables us to find distances out to 4 megaparsecs (40 megaparsecs with the Hubble Space Telescope).
15.4.5a Rung 5a: Galaxy Luminosity vs. Another Bright Feature
The periods and apparent brightnesses of Cepheids in other nearby galaxies are measured to get their distances. Then the galactic flux and the inverse square law of brightness are used to get the galactic luminosity. You can find the geometric sizes of H-II regions in spiral and irregular galaxies. From this you can calibrate the possible H-II region size–galactic luminosity relation. Or you can calibrate the correlation between the width of the 21-cm line (neutral hydrogen emission line) and the spiral galaxy luminosity. The width of the 21-cm line is due to rotation of the galaxy. This correlation is called the Tully-Fisher relation: infrared luminosity = 220 × Vrot4 solar luminosities if Vrot is given in units of km/sec. Elliptical galaxies have a correlation between their luminosity and their velocity dispersion, vdisp, within the inner few kpc called the Faber-Jackson law: vdisp approximately equals 220 × (L/L*)(1/4) km/sec, where L* = 1.0 × 10¹⁰ × (Ho/100)-2 solar luminosities in the visual band and the Hubble constant Ho= 60 to 70 km/sec/Mpc.
15.4.5b Rung 5b: Luminosity or Size of Bright Feature
Cepheids are found in other nearby galaxies to get their distance. Then the luminosity of several things are calibrated: (a) the supernova type 1a maximum luminosity in any type of galaxy; (b) the globular cluster luminosity function in elliptical galaxies; (c) the blue or red supergiant stars relation in spirals and irregulars; (d) the maximum luminosity–rate of decline relation of novae in ellipticals and bulges of spirals; and (e) the planetary nebula luminosity function in any type of galaxy.
The Rung 5 methods can be used to measure distances out to 50 to 150 megaparsecs depending on the particular method.
15.4.6 Rung 6: Galaxy Luminosity and Inverse Square Law
The Hubble Law is calibrated using rung 4 methods for nearby galaxy distances and rung 5 methods for larger galaxy distances. If those rung 5 galaxies are like the nearby ones (or have changed luminosity in a known way), then by measuring their apparent brightness and estimating their luminosity OR by measuring their angular size and estimating their linear size, you can find their distance. You need to take care of the effect on the measured velocities caused by the Milky Way falling into the Virgo Cluster. You can also calibrate the galaxy cluster luminosity function.
The Hubble law relates a galaxy’s recession (expansion) speed with its distance: speed = Ho × distance. Measuring the speed from the redshift is easy, but measuring the distance is not. You can calibrate the Hubble Law using galaxies out to 500 megaparsecs.
15.4.7 Rung 7: Hubble Law
This is the final rung in the distance scale ladder. You use the Hubble Law for all far away galaxies. You can make maps of the large-scale structure of the universe. The Hubble Law is also used to determine the overall geometry of the universe (how the gravity of the universe as a whole has warped it). You will see in the next chapter that the geometry of the universe determines the fate of the universe.
Rung 4 is a critical one for the distance scale ladder. With the Hubble Space Telescope, astronomers were able to use the Cepheid period-luminosity relation out to distances ten times further than what could be done on the ground. Previous ground measurements of the Hubble constant were 50 to 100 km/sec/Mpc. Using the Hubble Space Telescope, astronomers constrained its value to between 64 and 80 km/sec/Mpc with a best value of 72 km/sec/Mpc. More recently, the Hubble Constant has been narrowed even further to between 70.6 and 77.8 with a best value of 74.2 km/sec/Mpc. The value of 1/Ho is a rough upper limit on the age of the universe (assuming constant recession speeds!), so the new measurements imply an universe age of about 14 billion years. The favorite model for how the recession speeds have changed over the history of the universe gives an age of about 13.7 billion years with this value for the Hubble constant. This agrees with the ages derived for the oldest stars (found in globular clusters) of about 12 to 13 billion years.
Review Questions 4
- Why is finding accurate extragalactic distances so important?
- What are the more accurate or more certain ways to measure distances? What are the less accurate (less certain) ways to measure distances? Why are these techniques less certain?
- What is the Hubble Law? What two things does it relate? Why is it important?
A Final Word
The Sombrero Galaxy is one of the most photographed galaxies and this exquisitely beautiful picture from the Hubble Space Telescope shows why. There are number of beautiful objects that draw people to take up astronomy as a profession or a life-long hobby and the Sombrero Galaxy is one of them. Seeking to understand what these objects are made of, how they behave, and how they formed gives us a greater appreciation for the art that surrounds us. Visible in even small telescopes at the southern edge of the Virgo cluster of galaxies, the Sombrero Galaxy is a spiral galaxy more massive than the Milky Way seen nearly edge-on from a distance of about 28 million light years away.
This image also provides a nice illustration of the parts of a spiral galaxy and its history. The oldest stars are in the spherical bulge & stellar halo retaining their randomly-oriented eccentric orbits of the original gas cloud from which the galaxy formed about 13 billion years ago. The stellar halo also sports almost 2000 globular clusters (the Milky Way has only about 150 globular clusters). The more massive stars in the spherical component added heavier elements (dust) to the newly-formed disk in which younger generations of stars are still forming. These younger stars have added to the dust layer that now outlines the disk and spiral arms. The fortunate slight tilt of the disk to our line of sight allows us to easily distinguish the near side of the disk from the far side. The disk star orbits are closely aligned to each other to make the very thin disk characteristic of spiral galaxies. A billion solar-mass black hole lies at the heart of the bright core.
Select the image to go to the webpage in the Hubble Heritage Team’s website from which this image came. Larger versions of this image are available from the Hubble Site for the general public.

