
This chapter was copied with permission from Nick Strobel’s Astronomy Notes. Go to his site at www.astronomynotes.com for the updated and corrected version.
Interstellar Medium and the Milky Way
This chapter covers: the dust and gas between the stars and how we use the 21-cm line radiation to map the Galaxy. Also, the structure of the Milky Way Galaxy, our place in it, and how we determine these things. The rotation curve and the existence of the dark matter halo, stellar populations, and the galactic center are also discussed. Updates include: new illustrations for determining the presence of dark matter and a report on detecting the new arm of the Milky Way.
14.1 Introduction
Our solar system is inside a large galaxy known as the Milky Way. All of the stars you can see at night and several hundred billion more are all bound together gravitationally into a huge cluster called a galaxy. Most of the stars in our galaxy are far enough away that they blend together in a thin band across the sky. If you are fortunate enough to view a dark sky outside of the glare of the city lights, you will see this milky band running through the constellations Cassiopeia, Perseus, Taurus, Monoceros, Vela, Crux, Norma, Sagittarius, Scutum, Aguila, Cygnus, and Lacerta. To people of long ago, this band looked like milk had been spilled along a pathway, so it was called the Milky Way. This chapter covers the radical discoveries made in the 20th century of the nature of the Milky Way and our place in it. The vocabulary terms are in boldface.
14.2 Interstellar Medium (ISM)
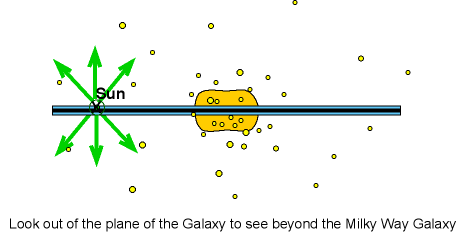
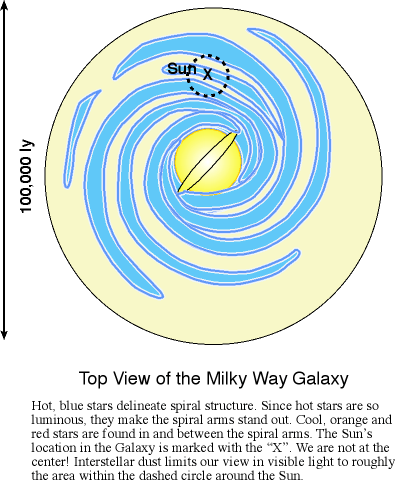
If you are sitting in an ordinary chair, lean over and look at the ground directly below your head. A cylinder the diameter of your eye drawn from your eye to the ground would enclose about as many particles of air as there are interstellar particles in a cylinder of the same diameter but extending between our solar system and the center of our galaxy 27,000 light years away. Though the space between the stars is emptier than the best vacuums created on the Earth (those are enclosed spaces devoid of matter, not the household cleaning appliances), there is some material between the stars composed of gas and dust. This material is called the interstellar medium. The interstellar medium makes up between 10 to 15% of the visible mass of the Milky Way. About 99% of the material is gas and the rest is “dust”. Although the dust makes up only about 1% of the interstellar medium, it has a much greater effect on the starlight in the visible band—we can out see only roughly 6000 light years in the plane of the Galaxy because of the dust. Without the dust, we would be able to see through the entire 100,000 light year disk of the Galaxy. Observations of other galaxies are done by looking up or down out of the plane of the Galaxy. Dust provides a place for molecules to form. Finally, probably the most of important of all is that stars and planets form from dust-filled clouds. Therefore, let us look at the dust first and then go on to gas. The structure of the Galaxy is mapped from measurements of the gas.
14.2.1 Dust
The dust is made of thin, highly flattened flakes or needles of graphite (carbon) and silicates (rock-like minerals) coated with water ice. Each dust flake is roughly the size of the wavelength of blue light or smaller. The dust is probably formed in the cool outer layers of red giant stars and dispersed in the red giant winds and planetary nebulae.
14.2.1.1 Extinction
Starlight passing through a dust cloud can be affected in a couple of ways. The light can be totally blocked if the dust is thick enough or it can be partially scattered by an amount that depends on the color of the light and the thickness of the dust cloud. All wavelengths of light passing through a dust cloud will be dimmed somewhat. This effect is called extinction.
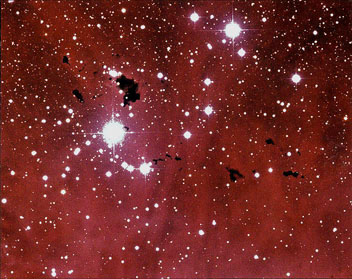 Dark dusk clouds like these “Bok globules” in IC 2948 were once thought to be holes in the sky. The dark clouds block the light from the emission nebula behind. |
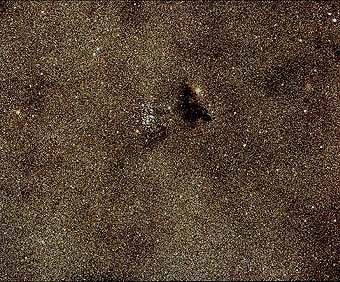 A dark cloud, Barnard 86, is silhouetted against a starry background. Stars form in the dark clouds. A young cluster, NGC 6520, probably associated with Barnard 86 is seen just to the left of it. |
The discovery of the dust is relatively recent. In 1930 R. J. Trumpler (lived 1886–1956) plotted the angular diameter of star clusters vs. the distance to the clusters. He derived the distances from inverse square law of brightness: clusters farther away should appear dimmer. IF clusters all have roughly the same linear diameter L, then the angular diameter q should equal a (constant L) / distance. But he found a systematic increase of the linear size of the clusters with distance.
This seemed unreasonable! It would mean that nature had put the Sun at a special place where the size of the clusters was the smallest. A more reasonable explanation uses the Copernican principle: the Sun is in a typical spot in the Galaxy. It is simply that more distant clusters have more stuff between us and cluster so that they appear fainter (farther away) than they really are. Trumpler had shown that there is dust material between the stars! The extinction of starlight is caused by the scattering of the light out of the line of sight, so less light reaches us.
14.2.1.2 Reddening
Not all wavelengths are scattered equally. Just as our air scatters the bluer colors in sunlight more efficiently than the redder colors, the amount of extinction by the interstellar dust depends on the wavelength. The amount of extinction is proportional to 1/(wavelength of the light). Bluer wavelengths are scattered more than redder wavelengths.
The 1/λ behavior of the scattering indicates that the dust size must be about the wavelength of light (on the order of 10-5 centimeters). Less blue light reaches us, so the object appears redder than it should. This effect is called reddening, though perhaps it should be called “de-blueing”. If the dust particles were much larger (say, the size of grains of sand), reddening would not be observed. If the dust particles were much smaller (say, the size of molecules), the scattering would behave as 1/λ4. Trumpler showed that a given spectral type of star becomes increasingly redder with distance. This discovery was further evidence for dust material between the stars. If the Sun is in a typical spot in the Galaxy, then Trumpler’s observation means that more distant stars have more dust between us and them.
You see the same effect when you observe the orange-red Sun close to the horizon. Objects close to the horizon are seen through more atmosphere than when they are close to zenith. At sunset the blues, greens, and some yellow are scattered out of your line of sight to the Sun and only the long waves of the orange and red light are able to move around the air and dust particles to reach your eyes.

At near-infrared (slightly longer than visible light) the dust is transparent. At longer wavelengths you can see the dust itself glowing and you can probe the structure of the dust clouds themselves as well as the stars forming in them (young stars that are hidden from us in the visible band). The Spitzer Space Telescope observes in the infrared and has opened up a new universe to us. Although it is not the first infrared space telescope, it is the largest infrared space telescope ever launched so it has the greatest light-gathering power and resolution of any infrared telescope. A couple of examples of the power of infrared I use in my class are the movie of the dark globulae IC 1396 and the movie of Herbig-Haro 46/47 on the Spitzer images site that transitions from the visible light image to the near infrared to the mid-infrared. Other movies contrasting the views at visible with infrared of other places in the galaxy as well as other galaxies are available there too.
Vocabulary
- dust
- extinction
- interstellar medium
- reddening
Review Questions 1
- What is the interstellar medium composed of?
- How do astronomers know that the non-gaseous part of the ISM cannot be made of rocks but, rather, of small “dust” particles?
- How does dust make stars appear redder than they actually are?
- How does dust cause the extinction of starlight?
- Where is the dust thought to come from?
14.2.2 Gas
About 99% of the interstellar medium is gas with about 90% of it in the form of hydrogen (atomic or molecular form), 10% helium, and traces of other elements. At visible wavelengths, however, dust has a greater effect on the light than the gas. The presence of interstellar gas can be seen when you look at the spectral lines of a binary star system. Among the broad lines that shift as the two stars orbit each other, you see narrow lines that do not move. The narrow lines are from much colder gas in the interstellar medium between us and the binary system.
The hydrogen gas is observed in a variety of states: in ionized, neutral atomic, and molecular forms. The ionized hydrogen emits light in the visible band as the electrons recombine with the protons and the neutral atomic and molecular hydrogen emits light in the radio band of the electromagnetic spectrum.
14.2.2.1 H II Regions
H II regions are regions of hot (several thousand K), thin hydrogen emission nebulae that glow from the fluorescence of hydrogen atoms. The roman numeral “II” of H II means that hydrogen is missing one electron. A He III nebula is made of helium gas with two missing electrons. A H I nebula is made of neutral atomic hydrogen. Ultraviolet light from hot O and B stars ionizes the surrounding hydrogen gas. When the electrons recombine with the protons, they emit light mostly at visible wavelengths, and primarily at a wavelength of 656.3 nanometers (giving the hydrogen emission nebulae their characteristic red color). In this conversion of the ultraviolet energy, each ultraviolet photon produces a visible photon. The temperature of the stars causing the nebula to fluoresce can be estimated from this even though the O and B stars are hidden inside the nebula. Fluorescent light bulbs operate on the same basic principle except they use mercury vapor to produce ultraviolet light. The ultraviolet light is then converted to visible light by the phosphor layer on the inside of the glass bulb.
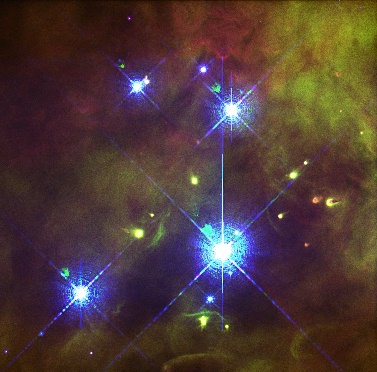
Below is a famous H II region called the Orion Nebula. It is the fuzzy patch you can see in the sword part of the Orion constellation. It is the closest large star formation factory to us and is explored in more detail in the stellar evolution chapter. Selecting the image will bring up a close-up of the heart of the nebula in another window showing the four hot “Trapezium” stars (four O and B stars making a trapezoid figure) at the center of each of the images by AAO and HST.
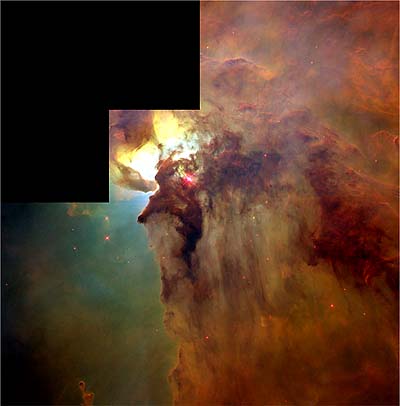
Another large H II region is the Lagoon Nebula in the constellation Sagittarius. It is about 5000 light years away and spans 90 by 40 arc minutes in our sky. Converting the angular size to a linear size, the Lagoon Nebula is about 130 by 60 light years in extent (the Orion Nebula is only 29 by 26 light years in size). The complex interaction of the intense radiation from the hot stars lighting up the nebula, varying densities of the gas and dust, and temperature differences creates twisted, turbulent features in the nebula that have been explored by the Hubble Space Telescope. Selecting the image will bring up the high-resolution image of the heart of the Lagoon Nebula from the Hubble Space Telescope in another window.
AAO imageNext to the Lagoon Nebula on our sky (but closer to us in space) is the Trifid Nebula, so-called because of the dust lanes that trisect the H II region behind them. The image below is nice one to illustrate the three types of nebulae: the red H II region behind a dark dust nebula (showing the effect of the extinction of light) and next to them a blue reflection nebula (showing the preferential scattering of shorter wavelengths).
O and B-type stars are only found in regions of star formation because they are young stars. These hot, very luminous stars do not live long enough to move away from where they were formed. Since stars form in clusters, where O and B stars are found, there are sure to be smaller, lower-mass stars still forming. The spectra of H II regions are much simpler than star spectra so they are easier to decipher. The composition and conditions inside the H II regions are easier to determine and understand than for stars, so H II regions provide a valuable tool for understanding the history of star formation in a galaxy.
H II regions also provide a convenient way to map the structure of a galaxy because they are so large and luminous. In our galaxy the H II regions are distributed in a spiral pattern. The best wavelengths to use to map the distribution of hydrogen, however, are in the radio band. Most of the hydrogen gas is not ionized because O and B stars are rare. Also, energy in the form of radio passes easily through dust.
14.2.2.2 21-cm Line Radiation
Most of the hydrogen gas in the interstellar medium is in cold atomic form or molecular form. In 1944 Hendrik van de Hulst predicted that the cold atomic hydrogen (H I) gas should emit a particular wavelength of radio energy from a slight energy change in the hydrogen atoms. The wavelength is 21.1 centimeters (frequency = 1420.4 MHz) so this radiation is called 21-cm line radiation. The atomic hydrogen gas has temperatures between 100 K to about 3000 K.
Most of the hydrogen in space (far from hot O- and B-type stars) is in the ground state. The electron moving around the proton can have a spin in the same direction as the proton’s spin (i.e., parallel) or spin in the direct opposite direction as the proton’s spin (i.e., anti-parallel). The energy state of an electron spinning anti-parallel is slightly lower than the energy state of a parallel-spin electron. Remember that the atom always wants to be in the lowest energy state possible, so the electron will eventually flip to the anti-parallel spin direction if it was somehow knocked to the parallel spin direction. The energy difference is very small, so a hydrogen atom can wait on average a few million years before it undergoes this transition.
Even though this is a RARE transition, the large amount of hydrogen gas means that enough hydrogen atoms are emitting the 21-cm line radiation at any one given time to be easily detected with radio telescopes. Our galaxy, the Milky Way, has about 3 billion solar masses of H I gas with about 70% of it further out in the Galaxy than the Sun. Most of the H I gas is in disk component of our galaxy and is located within 720 light years from the midplane of the disk. What’s very nice is that 21-cm line radiation is not blocked by dust! The 21-cm line radiation provides the best way to map the structure of the Galaxy.
14.2.2.3 Using 21-cm line radiation to Map the Galaxy
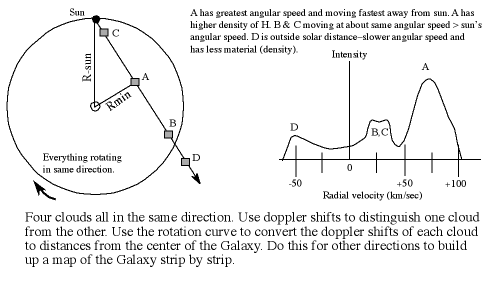
The intensity of the 21-cm emission line depends on the density of the neutral atomic hydrogen along the line of sight. Atomic hydrogen all along the line of sight will contribute to the energy received. You need a way to determine the distance to each clump of hydrogen gas detected. Then when you observe the Galaxy in different directions, you can get a three-dimensional picture of the Galaxy. Using the rotation curve, the Doppler-shifted radio emission can be converted into distances to the hydrogen clouds.
The rotation curve is a plot of the orbital velocity of the clouds around the galactic center vs. their distance from the Galaxy center. The term “rotation” in this context refers to the motion of the galactic disk as a whole—the disk made of stars and gas clouds appears to spin. The gas clouds are assumed to move in the plane of the disk on nearly circular orbits. Jan Oort (lived 1900–1992) found in 1927 that stars closer to the galactic center complete a greater fraction of their orbit in a given time than stars farther out from the center. This difference in the angular speeds of different parts of the galactic disk is called differential rotation.
The rotation curve can be determined by looking at the Doppler velocities of hydrogen gas along different lines of sight. The 21-cm emission will include contributions of hydrogen at different distances from the galactic center and different Doppler shifts with respect to us. Some of the emission will be from gas clouds just inside the orbit the orbit of the Sun moving at slightly faster angular speeds than the Sun. They will have a small redshift. The part of the total emission coming from gas closest to the galactic center will have the greatest redshift because that gas is moving at the greatest angular speed. In the figure below the line from the galactic center to the fast moving gas (called “Rmin” ) makes a 90° angle with respect to our line of sight. Using basic trigonometry, the distance of the fast moving gas (at “A” ) from the galactic center = (the Sun’s distance)× sin[(galactic longitude)], where the galactic longitude is the angular separation between the cloud and the galactic center and sin() is the “trigonometric sine” function (it is the “sin” key on a scientific calculator). Angle by angle, strip by strip, the rotation curve is constructed from the maximum Doppler velocity along different lines of sight.
Once the rotation curve is determined, the Galaxy’s structure can be mapped. The 21-cm line profile has several Doppler shifted peaks that are narrow and well-defined (see the figure below). Using the known rotation curve, you can convert the Doppler speeds of the peaks to get the distance to the hydrogen producing each peak. The intensity of each peak depends on the density of the hydrogen gas cloud. The mapping surveys show that the hydrogen gas is distributed in a spiral pattern in a thin disk for almost all of the Galaxy. At a recent Chautauqua short course on radio astronomy at Green Bank, two classmates and I used this technique to see if we could detect the newly-discovered outer arm of the Milky Way with the 40-foot radio telescope. To read more about our test, see my “Day-5 Chautauqua 2011” report.
14.2.2.4 Molecules
Different types of atoms can combine in the coldest regions of space (around 10 K) to make molecules. The cold molecules are detected in the radio band. Most of the molecules are hydrogen molecules (H2) and carbon monoxide (CO). Actually, molecular hydrogen does not emit radio energy but it is found with carbon monoxide, so the radio emission of CO is used to trace the H2. Other molecules include such familiar ones as H2O (water), OH (hydroxide), NH3 (ammonia), SiO (silicon monoxide), CO2 (carbon dioxide) and over a hundred other molecules. Many of the molecules have carbon in them and are called organic molecules.The organic molecules and the water and ammonia molecules are used in biochemical reactions to create the building blocks of life: amino acids and nucleotides. The presence of these molecules in the interstellar medium shows that some of the ingredients for life exist throughout the Galaxy. Some carbonaceous meteorites reaching the Earth have amino acids in them—apparently, amino acids can be created in conditions too harsh for normal biological processes.
Based primarily on observations of the CO emission, astronomers find that the molecules in the interstellar medium are clumped together into clouds with masses anywhere from just a few solar masses to over a million solar masses with diameters ranging from several light years to over 600 light years. Molecules need to have some sort of shielding from the high-energy light from stars. Otherwise, the energetic photons would dissociate the molecules. Molecular clouds have dust in them. The dust grains may provide the shelter for molecules to form. Compared to the size of atoms, the dust grains are enormous and have many pits and recesses for atoms to congregate and combine.
Stars form in the molecular clouds. If the molecular cloud is cold and dense enough, it can collapse under its own gravity. Smaller fragments can form and produce stars (see the stellar evolution chapter for further details). The Milky Way has about 2.5 billion solar masses of molecular gas with about 70% of it in a ring extending from 13,000 to 26,000 light years from the center. Not much molecular gas is located at 4,900 to 9,800 light years from center but about 15% of the total molecular gas mass is located close to galactic center within 4,900 light years from the center. Most of the molecular clouds are clumped in the spiral arms of the disk and stay within 390 light years of the disk midplane.
Molecular Hydrogen and Carbon Monoxide Connection
Molecular hydrogen H2 does not produce radio emission. It produces absorption lines in the ultraviolet. However, the gas and dust become so thick in a molecular cloud that the ultraviolet extinction is too large to accurately measure all of the H2 in the interior of the cloud. Fortunately, there is evidence of a correlation between the amount of CO and H2, so the easily detected CO radio emission lines (at 2.6 and 1.3 mm) are used to infer the amount of H2. The CO emission is caused by H2 molecules colliding with the CO molecules. An increase in the density of the H2 gas results in more collisions with the CO molecules and an increase in the CO emission.
Another nice feature of the CO radio emission is that its wavelength is small enough (about 100 times smaller than 21-cm line radiation) that even medium-sized radio telescopes have sufficient resolution to map the distribution of the molecular clouds. The higher resolution of large radio telescopes can be used to probe the structure of individual molecular clouds. There is some controversy about how the molecules are clumped together in the clouds. Is one gas cloud actually made of many smaller gas clouds? There is some evidence that indicates that 90% of the H2 is locked up in 5000 giant molecular clouds with masses greater than 105 solar masses and diameters greater than 65 light years. The largest ones, with diameters greater than 160 light years, have more than a million solar masses and make up 50% of the total molecular mass. Other studies indicate that the giants are actually made of smaller clouds grouped together into larger complexes.
Vocabulary
- differential rotation
- HII region
- rotation curve
- 21-cm line radiation
Review Questions 2
- What are the characteristics of the gaseous part of the ISM? Is the gas all at the same temperature and density? How do you know?
- What are H II regions and how are they produced? What is going on at the atomic level?
- Why would the presence of a H II region indicate the site of star formation?
- How does the gas far from any star make its presence seen in the optical wavelengths and radio wavelengths?
- How is the 21-cm line radiation produced?
- Why is the 21-cm line radiation so important for determining galactic structure and mass?
- How is the 21-cm line radiation used to determine galactic structure and mass?
- Which part of the Galaxy has greater angular speed? How do you determine the rotation curve of the Galaxy from the Doppler shifts of the gas?
- Where are most of the interstellar molecules found and how are they detected?
- What is the importance of the discovery of organic molecules in the interstellar medium?
- If the hydrogen molecules produce no radio emission, how do you map its distribution over the entire galaxy?
14.3 Galactic Structure
Determining the structure of our galaxy is not an easy task because the solar system is stuck inside the Galaxy and we can only look in all different directions. Our situation is like you having to determine the layout of your hometown from just looking out on your front porch (or back porch) and not being able to move even across the street. The fact that you see a narrow band of stars tells you that our galaxy is shaped like a thin disk. If we lived in a more spherical galaxy, the stars would be distributed more uniformly around the sky. There is a hint of a bulge in the direction of the Sagittarius constellation. Careful star counts and determining their distances shows hints of a spiral pattern in the disk. The interstellar dust limits our view a small section of the Galaxy. However, clear evidence of the spiral structure in the disk comes from the 21-cm line radiation discussed in the previous section.
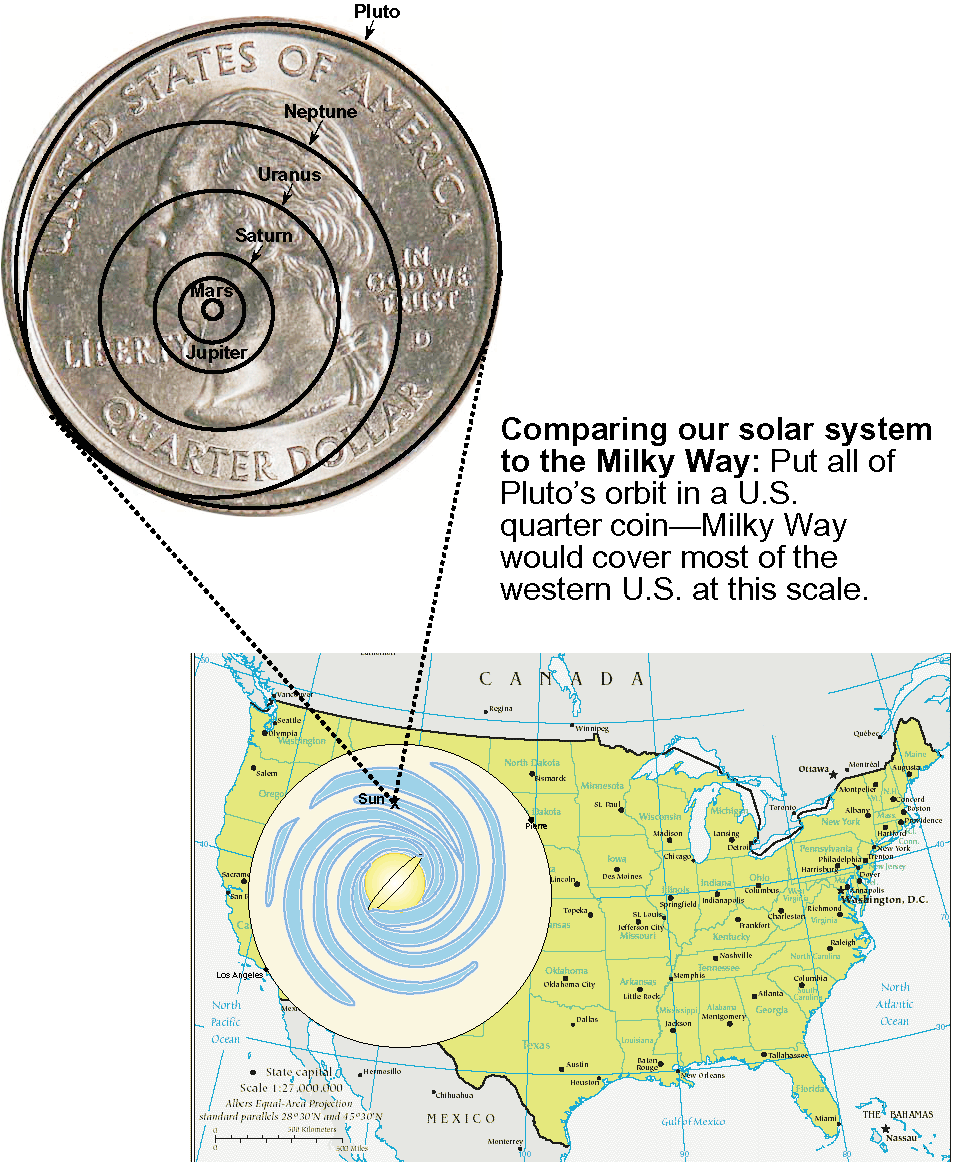
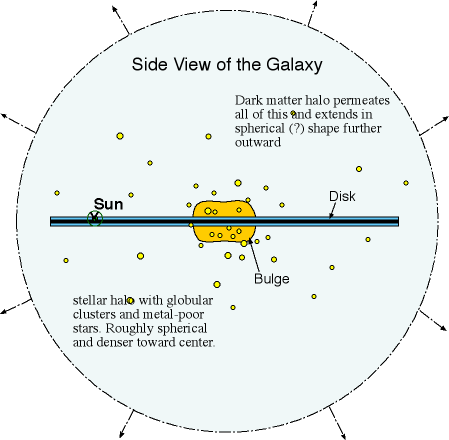
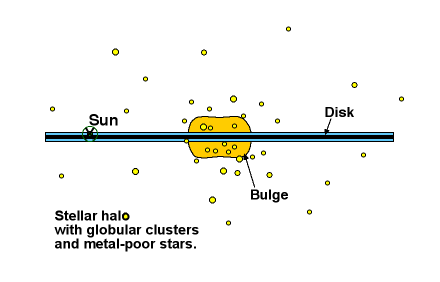
Our galaxy, the Milky Way, is disk-shaped with spiral arms in the disk. It has an elliptical bulge in the center with a bar-shaped distribution of gas/dust/stars going through the middle out of which the spiral arms extend and a spherical halo of stars that is denser closer to the Galaxy center. The disk of stars is about 100,000 light years across but only about 1000 light years thick (the dust layer is even thinner). The bar going through the middle of the bulge is about 25,000 by 4000 light years in dimension. Our solar system is about two-thirds of the way out from the center in a spur off one of the major spiral arms. For comparison, our solar system with the Oort Cloud is about 1 light year across. If Pluto’s orbit were fit inside a U.S. quarter coin (so 80 AUs scaled to 24.26 mm), the Oort Cloud would be about 19 meters across, the next star system (Rigel Kentaurus & companions) would be about 84 meters away and the Galaxy would be about 1920 kilometers across (select the figure below to bring up a larger version).
You can make a rough guess of the number of stars in our galaxy by dividing the Galaxy’s total mass by the mass of a typical star (e.g., 1 solar mass). The result is about 200 billion stars! The actual number of stars could be several tens of billions less or more than this approximate value. The disk contains over 98% of the dust and gas in the Galaxy. The bulge is made of a few tens of billions of stars while the stellar halo that extends out from it contains several hundreds of millions of stars. Most of the globular clusters are in the stellar halo and, like the halo stars, the number of them increases toward the galactic center. Astronomers have discovered that most of the mass of the Galaxy (and other galaxies) is not in the form of stars, gas, or dust. It is made of some other material, as yet unknown, and is given the descriptive name “dark matter”. Note that this affects your guess of the number of stars in the galaxy! (Does it increase the number or decrease it?) The dark matter halo may extend out two or three times the extent of the stars.
Our galaxy probably closely resembles the galaxy NGC 891 as seen edge-on. Note the prominent dust lanes going through the disk mid-plane and how flat the galaxy is.
14.3.1 Period-Luminosity Relation for Variable Stars
In the 1540s Nicolaus Copernicus removed the Earth from the center of the universe. He put the Sun at the center. Copernicus’ view held up against the observational evidence for hundreds of years. In the 1910s the Sun was removed from the center of the universe and relegated to a typical patch in the galactic disk far from the center of the Galaxy. Harlow Shapley (lived 1885–1972) made this discovery by determining the distances to very old star clusters. He used the inverse square law of light brightness on a particular type of variable star in those old star clusters.
Some stars are very useful for finding distances to clusters and to other galaxies because they have a known luminosity that is large, so they can be seen from great distances away. Bright objects of a known luminosity are called standard candles (though, in our modern day we should perhaps call them “standard bulbs”). Standard candle objects are used to measure large distances. The particular standard candle stars Shapley used are in the last stages of their lives and pulsate by changing size. They are trying to re-establish hydrostatic equilibrium but the thermal pressure is out of sync with the gravitational compression. The expanding star overshoots the equilibrium point. Then gravity catches up and contracts the star. But gravity contracts the star beyond the equilibrium point. The thermal pressure increases too much and the cycle continues.
14.3.1.1 Cepheids
In 1912 Henrietta Leavitt (lived 1868–1921) published the results of her study of variable stars in the Large and Small Magellanic Clouds. These are two small satellite galaxies orbiting the Milky Way. The linear size of each Magellanic Cloud is much smaller than its distance from us. Therefore, to a good approximation all of the stars in each galaxy are at the same distance from us. Leavitt found a very useful relationship for a certain type of variable star called a Cepheid variable (after the prototype in the constellation Cepheus; see stage 6 of a star’s life cycle). The fainter Cepheids in the Magellanic Clouds have shorter periods. Because all of the Cepheids in a Magellanic Cloud are at the same distance from us, Leavitt reasoned that the more luminous Cepheids pulsated more slowly. This is the period-luminosity relation. Leavitt did not know the distances to the Magellanic Clouds, so she could not tell what the actual value of the luminosity part of the relation was.
Astronomers had to wait a few years for Harlow Shapley to calibrate Leavitt’s relation using Cepheids in our galaxy for which the distances could be determined. In the calibration process Shapley put actual values to the luminosity part of the period-luminosity relation. With a calibrated period-luminosity relation astronomers could use Cepheid variables as standard candles to determine the distances to distant clusters and even other galaxies.
Cepheids have pulsation periods of 1 to 50 days. In the 1950s astronomers found that there are two types of Cepheids:
- Type I: classical Cepheids are from young high-metallicity stars and are about 4 times more luminous than Type II Cepheids. Below is the light curve (the plot of brightness vs. time) of a classical Cepheid from the Hipparcos database of variable stars.
- Type II: W Virginis Cepheids are from older low-metallicity stars and are about 4 times less luminous than Type I. Below is the light curve of a W Virginis Cepheid from the Hipparcos database of variable stars. Note the differences in the shape of the light curve. The two types of Cepheids are distinguished from each other by the shape of the light curve profile. In order to compare the shapes without having to worry about the pulsation periods, the time axis is divided by the total pulation period to get the “phase”: one pulsation period = one “phase”.
Because the luminosity of Cepheids can be easily found from the pulsation period, they are very useful in finding distances to the star clusters or galaxies in which they reside. By comparing a Cepheid’s apparent brightness with its luminosity, you can determine the star’s distance from the inverse square law of light brightness. The inverse square law of light brightness says the distance to the Cepheid = (calibration distance) × Sqrt[(calibration brightness)/(apparent brightness)]. Recall that brightnesses are specified in the magnitude system, so the calibration brightness (absolute magnitude) is the brightness you would measure if the Cepheid was at the calibration distance of 10 parsecs (33 light years). In some cases the calibration distance may be the already-known distance to another Cepheid with the same period you are interested in. Cepheid variable stars are so important that being able to measure their distances in other galaxies was the main factor in determining the size of the Hubble Space Telescope mirror and the measuring distances to Cepheids in 18 galaxies was the “Key Project” of the Hubble Space Telescope for its first decade (all of the other results and pretty pictures were bonuses!).
Early measurements of the distances to galaxies did not take into account the two types of Cepheids and astronomers underestimated the distances to the galaxies. Edwin Hubble measured the distance to the Andromeda Galaxy in 1923 using the period-luminosity relation for Type II Cepheids. He found it was about 900,000 light years away. However, the Cepheids he observed were Type I (classical) Cepheids that are about four times more luminous. Later, when the distinction was made between the two types, the distance to the Andromeda Galaxy was increased by about two times to about 2.3 million light years. Recent studies using various types of objects and techniques have given a larger distance of between 2.5 to 3 million light years to the Andromeda Galaxy (a measurement using eclipsing binaries gives a distance of 2.52 million light years; another measurement using red giants gives a distance of 2.56 million light years; another measurement using Cepheids gives 2.9 million light years; and measurements using RR-Lyrae give 2.87 to 3.00 million light years).
14.3.1.2 RR Lyrae
Another type of pulsating star similar to the Cepheids are the RR Lyrae variable stars (named after the prototype star RR Lyrae). They are smaller than Cepheids and, therefore, have shorter periods and lower luminosities. They pulsate with a period between 5 and 15 hours (Cepheid pulsation periods are greater than 24 hours). Low-mass stars will go through a RR Lyrae pulsation stage while the high-mass stars will go through a Cepheid stage. Because low-mass stars live longer than high-mass stars, the Cepheid stars as a group are younger than the RR Lyrae stars.
RR Lyrae are found in old star clusters called globular clusters and in the stellar halo part of our galaxy. All of the RR Lyrae stars in a cluster have the same average apparent magnitude. In different clusters, the average apparent magnitude was different. This is because all RR Lyrae have about the same average absolute magnitude (=+0.6, or 49 solar luminosities). If the cluster is more distant from us, the RR Lyrae in it will have greater apparent magnitudes (remember fainter objects have greater magnitudes!).
RR Lyrae stars can be used as standard candles to measure distances out to about 760,000 parsecs (about 2.5 million light years). The more luminous Cepheid variables can be used to measure distances out to 40 million parsecs (about 130 million light years). These distances are many thousands of times greater than the distances to the nearest stars found with the trigonometric parallax method. The method of standard candles (inverse square law) provides a crucial link between the geometric methods of trigonometric parallax and the method of the Hubble Law for very far away galaxies. (The Hubble Law is explained further later.)
14.3.2 Our Location
In 1918 Harlow Shapley used his calibrated variable star period-luminosity relation to find distances to 93 globular clusters. Globular clusters are spherical clusters of 100,000’s to several million stars (looking like a glob of stars) in very elliptical orbits around the center of the galaxy. Two globular clusters are shown below: Messier 5 (in Serpens Caput constellation) and 47 Tucanae (in the southern constellation Tucana).
 |
 |
In the side view picture of the Galaxy at the beginning of this section and below, the globular clusters are represented by the small circles congregating around the bulge of the Galaxy (they have been enlarged over a 100 times to make them visible). Shapley found a strong concentration of globular clusters in the direction of the constellation Sagittarius. In a continuation of the process started by Copernicus almost 500 years before, Shapley announced that our solar system is not at the center of the Galaxy!
If we were at the center of the Galaxy, we would see globular clusters equally distributed all around us. Instead, they congregate around some other point that Shapley calculated to be 32,600 light years from our solar system. He did not know about the dust in the interstellar medium. That discovery was made about a decade later. Taking into account the effects of dust extinction on the brightnesses of stars and also that there are different types of Cepheids, astronomers reduced the solar system’s distance to the center of the Galaxy to about 26,000 light years. More recent trigonometric parallax measurements of star formation regions using VLBI measurements has fine-tuned that to about 27,000 light years (see also this link). Our solar system’s position is marked with a cross in the pictures of the Galaxy at the beginning of this section.
14.3.3 Our Motion
Further evidence of Shapley’s discovery is seen in the motion of the Sun about the center. Globular clusters on one side of the celestial sphere have redshifts and globular clusters on the other side of the celestial sphere have blueshifts. Stars and H II regions near the Sun have small Doppler shifts. From this you can conclude that the galactic disk is rotating in an organized fashion but the globular clusters are not. The 21-cm line emission from neutral atomic hydrogen is now used to map the motion of the disk. Objects in the disk orbit about a common center that is 27,000 light years away in the direction of Sagittarius.
14.3.4 Deriving the Galactic Mass from the Rotation Curve
Recall from the Gravity Applications chapter that if you know the size of an object’s orbit and how quickly it is moving in its orbit, you can find the mass of the central object, or the mass of the two object’s orbiting around a common point. The same principle can be used to calculate the mass of the Galaxy! (Isn’t gravity wonderful?) In this case, the two masses involved are the mass of the star and the mass of the part of the Galaxy that is inside the star’s orbit. For most orbits the Galaxy mass inside the orbit is MUCH larger than the star’s mass, so it is safe to ignore the star’s mass.
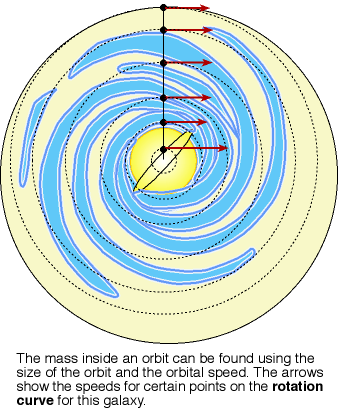
The gravity from the part of the Galaxy inside the star’s orbit accelerates the star so it moves in an orbit. The greater the gravity pulling on a star, the faster the star will move. Applying the mass and orbit speed relations of the gravity chapter, the enclosed mass inside the star’s orbit = (orbital speed)2 × (star’s distance to the galactic center)/G, where G is the gravity constant. The Galaxy’s mass is found from measuring the orbital speed of stars (or gas clouds) and their distance from the center.
From measurements of stars and hydrogen clouds in the galactic disk, astronomers construct a rotation curve for the Galaxy. This is a plot of the orbital speed of stars (or gas clouds) vs. their distance from the center of the Galaxy. The “rotation” part of the term refers to the motion of the disk as a whole. As a whole the disk seems to be rotating (spinning) even though it is really the individual stars and clouds that are orbiting around the center. The rotation curve tells you the the amount of mass inside a given distance from the center. You find how the mass is distributed in the Galaxy by looking at how the amount of enclosed mass changes with the size of the orbits.
Select the image to view a full-size version in another window
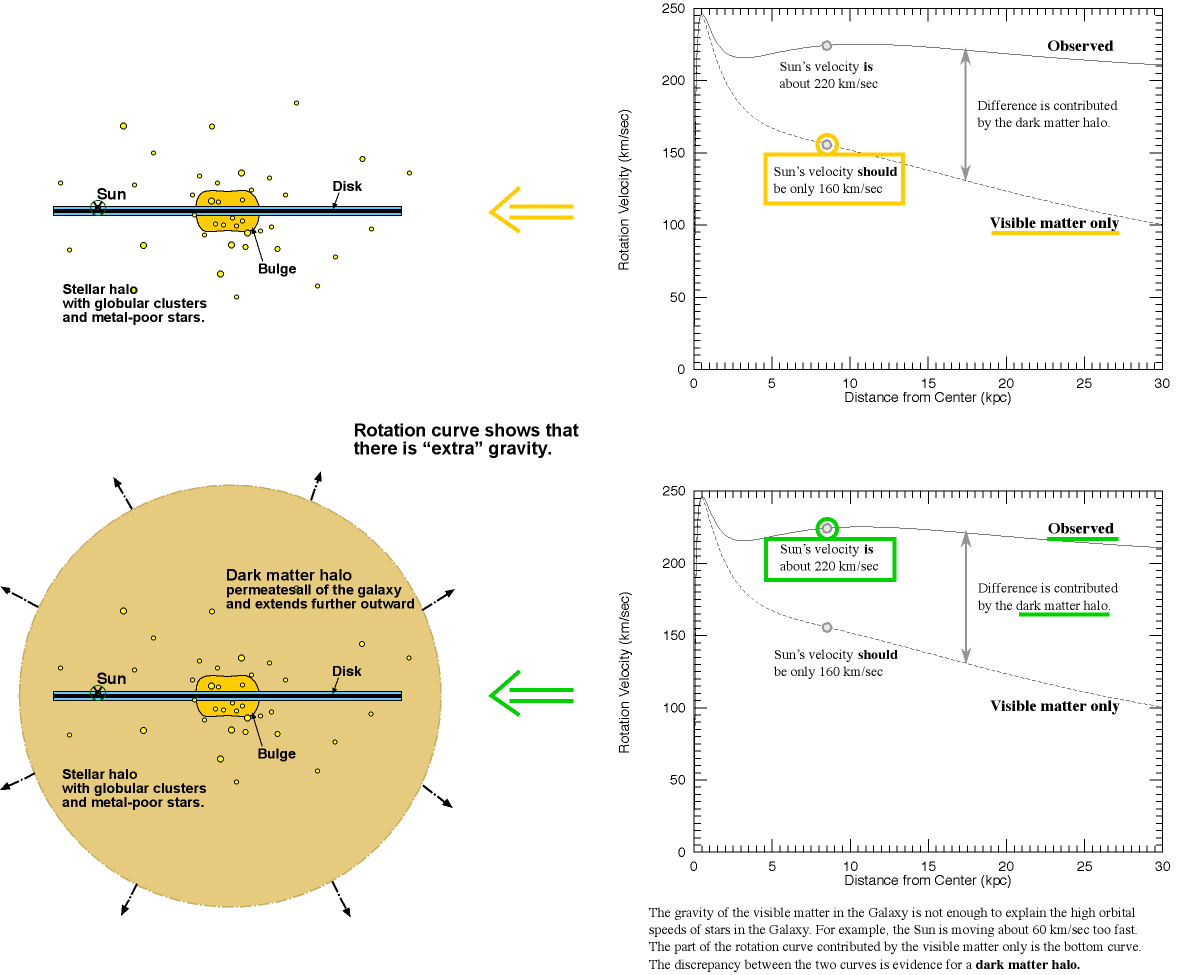
A rigid body rotation is seen close to the center (as if the part close to the center was rotating as one single object even though it is made of stars and gas), then the curve drops off, then rises, and eventually flattens out as far out as can be seen. Because gravity becomes weaker with larger (increasing) distance, the stars on the outskirts of the visible galaxy should be moving slower than those closer to where most of the visible mass resides. Instead, they are moving at about the same speed, even though they are farther from most of the visible matter! There must be extra mass in the Galaxy we cannot see to create the extra amount of gravity force. The Galaxy is spinning too quickly—the visible matter does not have enough mass to keep the Galaxy together! [Recent measurements on the size of the Milky Way using the VLBA have scaled the distances and speeds up—the Sun’s distance from the center is 8.4 kpc and the Sun’s speed is 254 km/sec—but how the speeds change with distance, the shape of the rotation curve, is still as described here.]
The observed rotation curve can be decomposed into the individual parts contributed by each component of the Galaxy: the disk, bulge + stellar halo, and the rest of total mass is what is called dark matter—material that does not emit any light (at least it is too faint to be detected yet) but has a significant amount of gravitational influence. The highest solid line in the left plot below is for all of the galactic components combined. The other curves (dashed, dotted, and solid) are the contributions of the individual galactic components (the bulge + stellar halo = “bulge”, disk, and the dark matter halo) to the rotational velocity. In the figure below, the dark matter halo is called the “corona.” Select the image to show a magnified view in another window.
The plot on the right shows the enclosed mass inside a given distance. If you reach the point where the enclosed mass does NOT increase with distance, then you will have found the edge of the Galaxy’s mass. Beyond the edge of the Galaxy, the rotational velocity will decrease as the distance from the center increases. Both plots show that the end of the Galaxy’s mass has not yet been found! The stars, dust, and gas in the disk and stellar halo do not explain all the mass. The part of the Galaxy that fills up the remainder of mass is the dark matter halo (corona). Ninety percent of the Galaxy’s mass is in the form of this dark matter! Unfortunately, because gravity depends only on the distance and mass and not the composition, astronomers are not certain what the dark matter is composed of. It could be in the form of planets, brown dwarfs (stars too small to shine from nuclear fusion), white dwarfs, black holes, neutrinos with mass, or other exotic particles that have not been discovered in the laboratory yet.
You may be a bit skeptical about the existence of this dark matter. Are not astronomers going “too far” with their speculations? Scientists, by nature, are skeptical themselves of any radical change in our understanding of the universe. However, nature and careful observations are the sole judge of scientific truth and even the smartest scientist must yield to what nature is telling us. The conclusion that dark matter exists has come from using the standard scientific method of observation, interpretation, and testing of the explanation. Looking back in history, the detection of dark matter is just another application of Newton’s law of gravity. Until Neptune was directly observed, its presence was known from its gravitational effect on Uranus (Neptune was “dark matter”). Astronomers have used the orbits and wobbling of stars to detect the presence of as yet, unseen companions around them (i.e., planets and black holes). The extrasolar planets and black holes are technically, dark matter too. They may be faint or invisible themselves, but they produce definite gravitational effects on nearby visible objects. At the other end of the scale, no one has ever directly seen an electron, but you know such a particle exists and is essential to our society of electricity and electronics.
14.3.5 Spiral Arms
The stars and gas and dust clouds in the disk congregate in a spiral pattern. There are four parts to the spiral pattern in our Galaxy called spiral arms. There are many stars that are also in-between the spiral arms, but they tend to be the dimmer stars (G, K, M-type stars). Long-lived stars will move in and out of the spiral arms as they orbit the galaxy. Star formation occurs in the spiral arms because the gas clouds are compressed in the arms to form stars. The very luminous, short-lived O and B-stars and H II regions around them enhance the spiral outline. They outline the spiral pattern the same way Christmas lights around the edges of a house will outline the borders of the house at night. The O and B-type stars live for only a few million years, not long enough to move outside of a spiral arm. That is why they are found exclusively in the spiral arms.
Differential rotation provides an easy way to produce a spiral pattern in the disk. Differential rotation is the difference in the angular speeds of different parts of the galactic disk so stars closer to the center complete a greater fraction of their orbit in a given time. But differential rotation is too efficient in making the spiral arms. After only 500 million years, the arms should be so wound up that the structure disappears. Also, the spiral pattern should occupy only a small part of the disk. The observations of other galaxies contradicts this: the spiral arms in spiral galaxies rarely have more than two turns. Galaxies are billions of years old so the spiral pattern must be a long-lasting feature. What maintains the spiral pattern?
14.3.5.1 Density Wave Theory
One popular theory says that the spiral structure is a wave that moves through the disk causing the stars and gas to clump up along the wave—a density wave. The spiral arms are where the stars pile up as they orbit the center. They are like the entrance ramps onto a busy highway during rush hour: when a car comes to the point where many other cars are merging, it slows down and cars jam up. But eventually, the car moves past the ramp and speeds up. A person in a helicopter above the traffic giving reports for the local radio station sees a traffic jam at the entrance ramp even though individual cars are moving through it. Another clump moving down the highway may be seen as cars pile up behind a slow-moving truck.
In a galaxy the spiral region of greater gravity concentrates the stars and gas. The spiral regions rotate about as half as fast as the stars move. Stars behind the region of greater gravity are pulled forward into the region and speed up. Stars leaving the region of greater gravity are pulled backward and slow down. Gas entering spiral wave is compressed. On the downstream side of wave, there should be lots of H II regions (star formation regions). This is seen in some galaxies with prominent two-armed spiral patterns. But there are some unanswered questions. What forms the spiral wave in the first place? What maintains the wave?
14.3.5.2 Self-propagating Star Formation
Another popular theory uses the shock waves from supernova explosions to shape the spiral pattern. When a supernova shock wave reaches a gas cloud, it compresses the cloud to stimulate the formation of stars. Some of them will be massive enough to produce their own supernova explosions to keep the cycle going. Coupled with the differential rotation of the disk, the shock waves will keep the spiral arms visible.
Computer simulations of galaxy disks with a series of supernova explosions do produce spiral arms but they are ragged and not as symmetrical and full as seen in so-called “grand-design” spirals that have two arms. There are spiral galaxies with numerous, ragged spiral arms in their disks (called “flocculent” spirals), so perhaps the self-propagating star formation mechanism is responsible for the flocculent spirals.
 A “grand-design”spiral seen face-on. |
 A flocculent spiral with ragged spiral arms. |
14.3.5.3 Transient Spirals
In this scenario the spiral arms come and go. This behavior is seen in computer simulations of galactic disks. It is possible that all three theories may be correct. Some galaxies (particularly the grand-design spirals) use the density wave mechanism and others use the self-propagating star formation or transient spiral mechanisms. Our galaxy may be an example of a spiral that uses more than one. The spiral density waves could establish the overall pattern in the disk and the supernova explosions could modify the design somewhat.
14.3.6 Populations of Stars
The astronomer Walter Baade (lived 1893–1960) working at Mount Wilson Observatory outside of Los Angeles was forbidden to work in the United States’ military research during World War II because of his German birth. Being a good astronomer, he took advantage of the dark skies from the frequent blackouts of Los Angeles during the war. He also had plenty of time at the telescope because the other astronomers were engaged in the war effort. In 1944 he discovered that the stars in our Galaxy can be divided into two basic groups: Population I and Population II.
The Population I stars are in the disk component of the Galaxy. They have a wide range of ages, from 0 to 10 billion years old. The youngest ones are in the spiral arms. Population I star orbits are orderly: roughly circular orbits close to the mid-plane of the galactic disk. Young star clusters made of Population I stars are called open clusters because the stars are loosely bound together, in contrast to the old, concentrated globular clusters.
Population I stars have a greater abundance of elements heavier than helium than the Population II stars. Elements heavier than helium are often called metals in astronomy even though many of them are not the shiny conductors called metals in popular usage. The Population I are said to be “metal-rich” in comparison to the Population II stars.
There is a continuum of the metal abundance and orbit shapes. The oldest Population I stars have 0.1 times the metal abundance of the Sun and have slightly elliptical orbits that can take them up to 3000 light years from the disk plane. The middle-aged stars like the Sun have metal abundances of 0.5 to 1 times solar abundance and can be found at heights up to 1100 light years from the disk plane. The young stars have metal abundances of 1 to 2 times the Sun’s abundance and stay within 650 light years of the disk plane. Stars less than 100 million years old are found in the spiral arms within 400 light years of the disk plane. They have circular orbits and metal abundances of 1 to 2.5 times solar abundance.
The Population II stars inhabit the spheroidal component (the stellar halo and bulge). They are old: ages range from 10 to 13 billion years old, so they have masses less than or equal to 0.8 solar masses. Their orbits are much more randomly oriented than the Population I orbits and are highly elliptical. The combination of all of the elliptical orbits randomly aligned produces the spherical distribution seen. As a unit the spheroidal component has little overall rotation. Old star clusters called globular clusters are in Population II. Because they swarm around the center like bees around a hive, the globular clusters were used to locate the center of the Galaxy.
The halo stars are metal-poor (0.001 to 0.03 times solar abundance), but the abundance increases inward toward the center. The bulge stars have metal abundances of 1 to 3 times that of the Sun. Early in the history of the Galaxy, there was probably a lot of star formation and death in the bulge component, so the metal content rose quickly. The star formation rate in the disk has been more steady, so it is slowly catching up to the bulge’s metal abundance. Star formation now occurs in just the disk. Eventually, the new disk stars will be born with greater metal abundance than the metal-richest bulge stars.
14.3.7 Galactic Center
The center of the Galaxy is in the direction of the constellation Sagittarius about 27,000 light years from our solar system. A strong radio source, called Sagittarius A, is seen at the center. The radio emission is non-thermal (synchrotron) radiation from rapidly moving charged particles spiraling around a strong magnetic field. X-rays are also seen coming from an object less than 3 light years across.
The plane of galactic disk runs from upper left to lower right. The parallel filaments are perpendicular to galactic plane. The image is about 190 light years across.
Stellar velocities found from the Doppler shifts of the spectral lines in the stars’ spectra near the center indicate the presence of a large, compact mass at the center with almost 4 million solar masses. It is probably a massive black hole formed by mergers of stars and stellar remnants. As you look closer to a super-massive black hole, you should see the stars nearer the black hole moving faster than the ones farther out. Stars nearer the super-massive black hole move fast enough to balance the stronger gravity closer to the black hole.
High-resolution infrared measurements of the orbits of the stars at the center show that a very compact mass—a super-massive black hole—with about 4.5 million solar masses lies at the center (if use our distance to the center as 8.4 kpc). The picture below (courtesy of Andrea Ghez and the UCLA Galactic Center Group) shows the orbits of the stars around the black hole from the years 1995 to 2008. At a distance of 8.4 kpc for the Sun, the 0.2 arc second scale bar in the figure corresponds to about 0.027 light years or 1680 AU. She has also released a movie of the orbits through early 2008 that also shows their predicted motions into the future. The object is too compact to be a dense cluster of stars—the Chandra X-ray Observatory’s observations of X-ray bursts from the object place an upper limit of the diameter of the object of the size of the Earth’s orbit. An expanding ring is also seen about 9000 light years from the center. Other galaxy cores have supermassive compact objects (the Andromeda Galaxy, M32, Sombrero Galaxy, M87, and many others).

Just because there is a large black hole at the center, does not mean that the stars in the Galaxy are all orbiting around it like the planets orbit the Sun. Even if the super-massive black hole was not there, the stars would still orbit pretty much as they do now because of their mutual gravity. If you compare the enclosed mass inside the Sun’s orbit (see the mass figure above) with the 4.5 million solar masses of the black hole, you will see that the central black hole’s mass is insignificant compared to the entire Galaxy.
Sections Review
Vocabulary
- Cepheid
- dark matter
- differential rotation
- galaxy
- globular clusters
- Milky Way
- period-luminosity relation
- Population I
- Population II
- rotation curve
- RR Lyrae
- standard candle
Formulae
- Inverse square law (standard candle): distance to the standard candle = (calibration distance) × Sqrt[(calibration brightness)/(apparent brightness)]. Calibration distance is either 10 parsecs or it is the distance to a similar object at a known distance.
- Orbital speed = Sqrt[(G × (enclosed mass))/(star’s distance from the galactic center)], where the enclosed mass is the mass of the galaxy inside the star’s orbit, and G is the gravity constant.
- Enclosed mass = (orbital speed)2 × (star’s distance from the galactic center) / G, where G is the gravity constant.
Review Questions 3
- What is the name for our galaxy and what kind of galaxy is it?
- How big is our galaxy? How many stars are in it and how do we know?
- How are Cepheids and RR-Lyrae stars considered to be standard candles? How can you find their luminosity?
- How can you use the period-luminosity relation to find distances?
- Why do variable stars like Cepheids, RR-Lyrae stars, and Mira variables vary in brightness?
- Where are we in the galaxy and how do you know? How can the distribution of globular clusters tell you about our place in the Galaxy?
- What are the four basic components of our galaxy? Where would old stars be found? Where would stars with very small amounts of “metals” (elements heavier than helium) be found? Where are new stars being formed? Where would stars enriched with “metals” be found?
- If you could analyze the spectra of 10 stars every second, how many years would it take you to check every star inside the Sun’s orbit that is in our half of the Galaxy? [Hint: used the “enclosed mass” graph, divide by 2, and our Sun’s distance from the center = 27,000 light years (8,400 parsecs).]
- What are the theories for how spiral arms are formed and maintained? What are the verifiable predictions made by these theories?
- How does the density wave theory explain why stars form in spiral arms? Also, contrast it with the explanation given by the self-propagating star formation theory.
- How do astronomers know the dark matter halo (corona) exists if it does not radiate anything our telescopes can detect?
- Scientists are advocating a focused search for extra-terrestrial intelligence that looks at stars relatively abundant in elements heavier than helium because those are the elements from which life could possibly form. What part(s) of the Galaxy would such stars be found and what are the distinguishing orbital characteristics of such stars?
- If very old stars tend to be metal-poor, how could you explain the presence of recently-formed stars that are metal poor?
- How do astronomers know that there is a very massive black hole at the center of the Galaxy?
- If there were no black hole in the center of the Galaxy, how would the orbits of the stars near the Sun be affected? (Hint: compare the mass of the black hole to the total mass inside the Sun’s orbit [black hole mass/total enclosed mass]—would the gravity change significantly?)
